
West Coast wind patterns lead to below-normal wind generation capacity factors
Note: Calculations are based on the output of wind plants in operation before 2010.
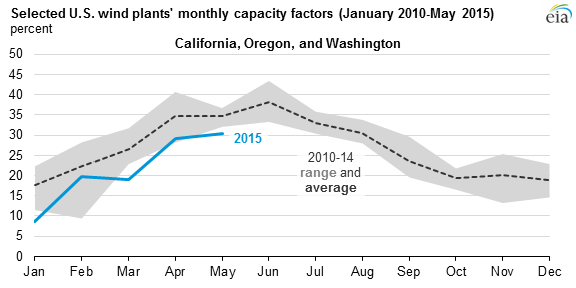
A drop in average wind speeds in the western United States during early 2015 led to reduced generation from wind plants in California, Oregon, and Washington. As a result, wind plant utilization rates, also known as plant capacity factors, were consistently below the previous five-year average during the first five months of 2015, according to the latest data available.
Capacity factors for wind turbines are largely determined by wind resources. Because the output from a turbine varies nonlinearly with wind speed, small decreases in wind speeds can result in much larger changes in output and, in turn, capacity factors. For instance, in January, wind speeds were approximately 20% to 45% lower than normal for some portions of the West Coast, but capacity factors for wind plants in California, Oregon, and Washington were approximately 50% lower than the January average of the previous five years.

In order to accurately compare performance over time, these calculations were based on the output of wind plants in operation before 2010, which excludes all of the new wind capacity added since then. At the end of 2009, these three states had a total of 6.3 gigawatts (GW) of wind capacity. By the end of 2014, their capacity had increased by an additional 5.3 GW. Wind generation in the three states increased from 12,882 gigawatthours (GWh) in 2009 to 28,614 GWh in 2014.
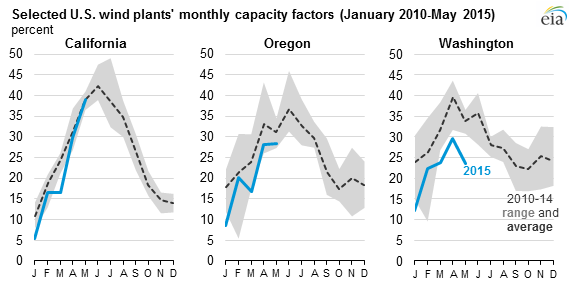
As 2015 has progressed, California wind turbine performance appears to have recovered to near-normal levels, but turbine performance in Oregon and Washington remains below average 2010-14 levels. In general, performance this past spring tended to be lower the farther north the turbines are located, with Washington turbine performance more than 25% below average levels in March, April, and May.
Wind plant generation variability occurs over different time scales, from subhourly to seasonally and even annually, reflecting variations in wind speeds. Unexpected drops in output may require grid operators to schedule other sources of power on short notice. Furthermore, because the federal tax credit for utility-scale wind energy is based on generation volumes, lower wind speeds mean reduced tax credits.
Note: Calculations are based on the output of wind plants in operation before 2010.
Capacity factors for wind turbines in Oregon and Washington vary much more by month than for wind turbines in California, largely as a result of California's favorable climate and geography. In the summer, ocean-cooled air in California interacts with the warmer mountains nearby to create a relatively reliable and well-timed land-sea breeze air circulation pattern. California's wind resources and generator output tends to peak during the summer at a time when electricity demand in the state is also relatively high.
Principal contributor: Fred Mayes
Tags: California, capacity, generation, Oregon, renewables, states, Washington, wind