Regional refinery trends evolve to accommodate increased domestic crude oil production

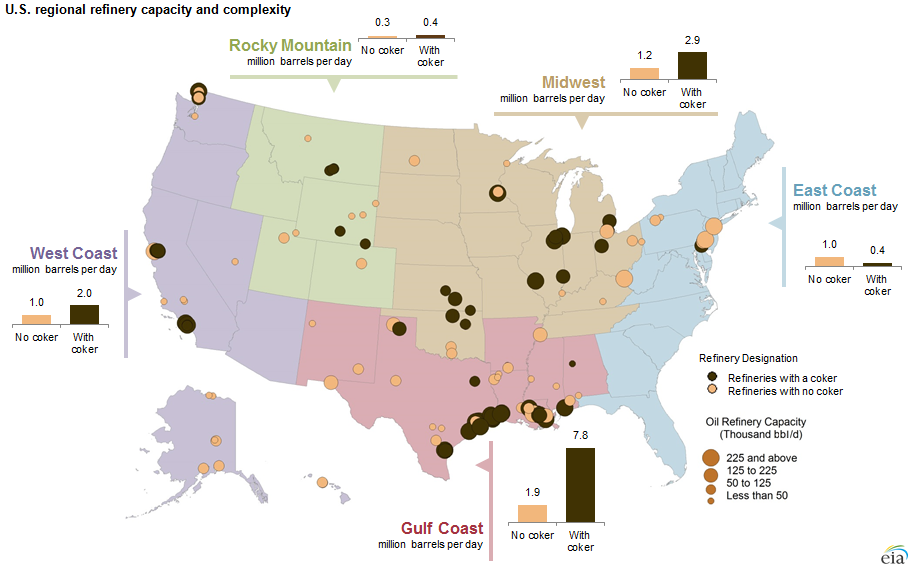
Note: As of January 1, 2014, there were 133 operating refineries with atmospheric crude oil distillation units (ACDU) totaling capacity of 18.9 million barrels per stream day. Heavy capacity denotes refineries with coking capacity; light capacity denotes refineries without coking capacity.
Note: Click to enlarge.
Recent rapid growth in U.S. production of light tight oil has raised interest in understanding how U.S. refineries, many of which are configured to process heavier crude oil, might accommodate increased volumes of domestic light crude. The U.S. refinery fleet, which is distributed across Petroleum Administration for Defense Districts (PADDs), varies both within and across regions in capacity, quality of crude oil inputs, utilization rates, and sources of crude supply.
What is stream day capacity?
Stream day capacity is the maximum number of barrels of input a distillation facility can process within a 24-hour period when running at full capacity under optimal crude and product slate conditions with no allowance for downtime. The stream day capacity is typically about 6% higher than the calendar day capacity, which reflects usual operating conditions including both planned and unplanned maintenance.
More than 50% of the country's refinery capacity and most of the country's heavy crude processing capacity is located in the Gulf Coast (PADD 3). The region's 51 operating refineries with atmospheric crude distillation units (ACDU) have capacity totaling 9.7 million barrels per stream day (bbl/sd), 81% of which is located at facilities with coking capacity. Coking units can upgrade heavy crude oil into higher-valued lighter products, such as distillate and gasoline. Recent expansions have increased ACDU and coking capacity by 625,000 bbl/sd and 160,000 bbl/sd, respectively, since 2010. Despite the expanded capacity, utilization has remained steady, and the region has recently set records for high levels of gross inputs.
Changes to crude oil supply patterns are most pronounced in the Gulf Coast. Net imports into the region have fallen by 2.3 million bbl/d, and light sweet crude imports have been largely replaced by domestically produced light, tight oil. In addition, from 2010 to 2014, the average API gravity of crude inputs rose by 1 degree. API gravity is an inverse measure of the density of a petroleum liquid relative to water, meaning that the higher the API gravity, the lower the density of the petroleum liquid compared to water. An increase in API gravity indicates that average crude slates are becoming lighter.
Crude oil production in the Gulf Coast region has increased by 1.9 million barrels per day since 2010. Gulf Coast receipts of crude oil from the Midwest (PADD 2), including both U.S. and Canadian production, also have increased. With more Canadian and domestic barrels moving south from the Midwest to the Gulf Coast region and lower demand for crude shipments from the Gulf Coast to the Midwest, net receipts for the Gulf Coast were positive in October 2014 for the first time since December 1985. This situation, with shipments and receipts of crude oil to and from other PADDs being roughly equal in the Gulf Coast region, is a change from the region's traditional role. The Gulf Coast has long been a source of crude supply for neighboring PADDs, both through the movement of domestic production and from imported crude oil coming into Gulf Coast ports.
With U.S. crude production in 2015 expected to average 9.3 million bbl/d, 700,000 bbl/d above the 2014 level, domestic refiners will continue to face changing supply and demand conditions, even as continued production growth in the first months of the year transitions to a more static production outlook as the effects of the recent sharp decline in oil prices are reflected in drilling decisions. Changes to infrastructure, refinery capacity, crude oil price differentials based on quality, and policy decisions will also affect refinery operations in the coming year. Further discussion of these changing dynamics for each region of the country can be found in the January 7 This Week in Petroleum.
Principal contributor: Hannah Breul
Tags: crude oil, liquid fuels, map, refining, tight oil