Net energy imports as share of consumption at lowest level in 29 years
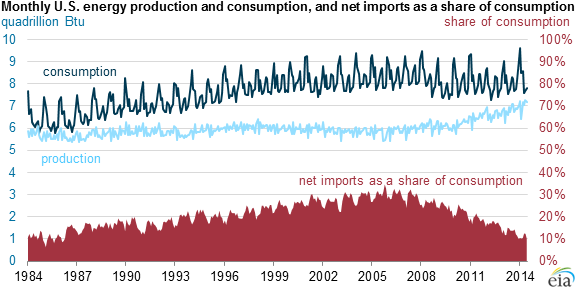
Total U.S. net imports of energy as a share of energy consumption fell to their lowest level in 29 years for the first six months of 2014. Total energy consumption in the first six months of 2014 was 3% above consumption during the first six months of 2013, but consumption growth was outpaced by increases in total energy production. These changes led to a 17% reduction in net imports compared with the first six months of 2013.
Total energy consumption increased every month in 2014 compared with the same month in 2013. However, 81% of the total increase in consumption came in January and February, reflecting the effect of colder weather during the polar vortex. Natural gas accounted for 55% of the 2014 year-to-date increase, coal for 24%, renewable energy for 12%, petroleum for 8%, and nuclear electric power for 3%. Of the total natural gas consumption increase, the residential and commercial sectors accounted for 69% of the gain, again reflecting the cold winter, while 30% of the increase came from the industrial sector, continuing a long-term trend toward higher industrial use of natural gas.
The increase in total energy production was almost entirely concentrated in petroleum and natural gas. Petroleum accounted for 52% of the 2014 year-to-date increase, natural gas for 27%, renewable energy for 9%, and nuclear electric power for 2%. In contrast, total coal production fell 1%. The increased liquids production reflects the use of advanced drilling methods, including hydraulic fracturing and horizontal drilling. These techniques have led to higher production in areas such as the Bakken Region, Marcellus Region, Eagle Ford play, and Permian Basin, and have greatly increased U.S. oil and natural gas production.
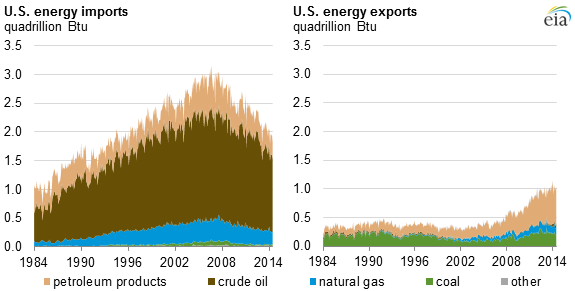
Total energy imports in the first six months of 2014 fell 6% compared with the first six months of 2013, almost entirely because of decreasing petroleum and natural gas imports, which fell 6% and 5%, respectively. Total energy exports increased 8% compared with the first six months of 2013. The increase was almost entirely the result of a 21% increase in petroleum product exports.
Principal contributor: Allen McFarland