Menu
Crude oil, gasoline, heating oil, diesel, propane, and other liquids including biofuels and natural gas liquids.
Exploration and reserves, storage, imports and exports, production, prices, sales.
Sales, revenue and prices, power plants, fuel use, stocks, generation, trade, demand & emissions.
Energy use in homes, commercial buildings, manufacturing, and transportation.
Reserves, production, prices, employment and productivity, distribution, stocks, imports and exports.
Includes hydropower, solar, wind, geothermal, biomass and ethanol.
Uranium fuel, nuclear reactors, generation, spent fuel.
Comprehensive data summaries, comparisons, analysis, and projections integrated across all energy sources.
Monthly and yearly energy forecasts, analysis of energy topics, financial analysis, congressional reports.
Financial market analysis and financial data for major energy companies.
Greenhouse gas data, voluntary reporting, electric power plant emissions.
Maps, tools, and resources related to energy disruptions and infrastructure.
State energy information, including overviews, rankings, data, and analyses.
Maps by energy source and topic, includes forecast maps.
International energy information, including overviews, rankings, data, and analyses.
Regional energy information including dashboards, maps, data, and analyses.
Tools to customize searches, view specific data sets, study detailed documentation, and access time-series data.
EIA's free and open data available as API, Excel add-in, bulk files, and widgets
Come test out some of the products still in development and let us know what you think!
EIA's open source code, available on GitHub.
Forms EIA uses to collect energy data including descriptions, links to survey instructions, and additional information.
Sign up for email subscriptions to receive messages about specific EIA products
Subscribe to feeds for updates on EIA products including Today in Energy and What's New.
Short, timely articles with graphics on energy, facts, issues, and trends.
Lesson plans, science fair experiments, field trips, teacher guide, and career corner.
EIA is continuing normal publication schedules and data collection until further notice.
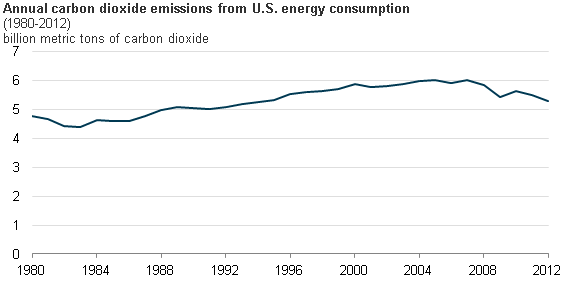
Energy-related carbon dioxide (CO2) emissions in 2012 were the lowest in the United States since 1994, at 5.3 billion metric tons of CO2 (see figure above). With the exception of 2010, emissions have declined every year since 2007.
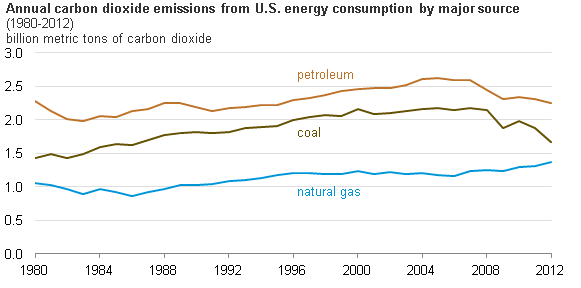
The largest drop in emissions in 2012 came from coal, which is used almost exclusively for electricity generation (see figure below). During 2012, particularly in the spring and early summer, low natural gas prices led to competition between natural gas- and coal-fired electric power generators. Lower natural gas prices resulted in reduced levels of coal generation, and increased natural gas generation—a less carbon-intensive fuel for power generation, which shifted power generation from the most carbon-intensive fossil fuel (coal) to the least carbon-intensive fossil fuel (natural gas).
Other factors contributing to the lower emissions include decreased demand for transportation fuels and mild winter temperatures that reduced demand for heating. The warm winter months during 2012 (particularly in the first quarter) more than offset a slight increase in cooling degree days during the summer months. EIA recently published preliminary data for January-December 2012 in the March 2013 edition of the Monthly Energy Review, which includes statistics covering all aspects of energy. EIA will publish a full analysis of 2012 energy-related CO2 emissions later this year.
Tags: CO2 (carbon dioxide), coal, consumption/demand, emissions, generation, liquid fuels, natural gas, oil/petroleum, weather