
February 2021 weather triggers largest monthly decline in U.S. natural gas production

In February 2021, a record-breaking cold snap hit the Lower 48 states. Extreme winter weather caused natural gas production freeze-offs and higher electricity and commodity prices, especially in the top energy-consuming state, Texas. The cold snap affected natural gas production and industrial sector consumption the most, which had the largest monthly declines on record, while residential sector consumption reached a record high.
U.S. natural gas production in February 2021—measured by gross withdrawals—averaged 104.8 billion cubic feet per day (Bcf/d), an 8.1 Bcf/d (7%) decrease from January, the largest monthly decline on record. Decreased natural gas production in Texas accounted for most of the overall decline. Texas natural gas production fell by a record 4.3 Bcf/d (15%) to 21.5 Bcf/d.
From February 8 to 17, natural gas production in Texas fell by more than 10 Bcf/d. The decline in natural gas production was mostly a result of freeze-offs, when water and other liquids in natural gas wells freeze at the wellhead or in natural gas gathering lines and block the flow. Texas natural gas production infrastructure is more susceptible to the effects of extremely cold weather because it is not winterized to the same extent as natural gas production infrastructure in colder, northern areas of the Lower 48 states.
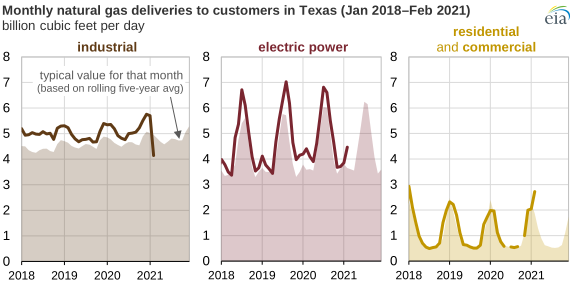
Note: Commercial sector data for June 2020 and residential sector data for October 2020 were not available.
In February, industrial sector natural gas consumption in Texas fell to 4.1 Bcf/d, or 23% lower than year-ago levels, the largest monthly decline on record. This drop relates to both the direct effects of the extreme cold weather, including power outages and equipment failure, and indirect effects, such as supply shortages and extreme prices. Texas is the largest natural gas-consuming state overall because of its large volumes of consumption in its industrial sector.
In February, U.S. consumption of natural gas in the residential sector typically decreases compared with January. Instead, Texas experienced a monthly increase in residential sector consumption because of the extreme cold weather when temperatures remained below freezing for several days. Residential sector consumption in Texas during February reached a monthly record high of 1.8 Bcf/d, 53% higher than year-ago levels and 64% higher than the five-year average. Similarly, commercial sector consumption of natural gas in Texas increased in February, reaching 0.92 Bcf/d, the highest level since January 2018.
In Texas’s electric power sector, consumption was essentially flat year over year for February at 4.5 Bcf/, an increase of 1% compared with February 2020. More than 60% of homes in Texas use electricity for home heating, meaning that February’s cold snap should have led to a surge in electricity consumption. However, electricity outages across Texas limited consumption.
On February 17, the U.S. benchmark Henry Hub natural gas spot price reached $23.86 dollars per million British thermal unit (MMBtu). By contrast, residential and commercial natural gas prices remained fairly flat for the month in most states because of regulatory policies that set price parameters in advance.
Principal contributors: Mike Kopalek, Emily Geary
Tags: production/supply, natural gas, weather, Texas, states