
Gasoline prices ahead of Memorial Day are higher than 2016, but second lowest since 2009
Gasoline prices heading into Memorial Day weekend average $2.40 per gallon (gal) nationally, up from last year's price of $2.30/gal. Despite the year-over-year increase, 2017 marks the second-lowest price ahead of the Memorial Day weekend since 2009, when the national average price of retail regular gasoline was $2.31/gal. Relatively low crude oil spot prices, weaker year-over-year gasoline demand, and high gasoline inventories have contributed to relatively low gasoline prices.
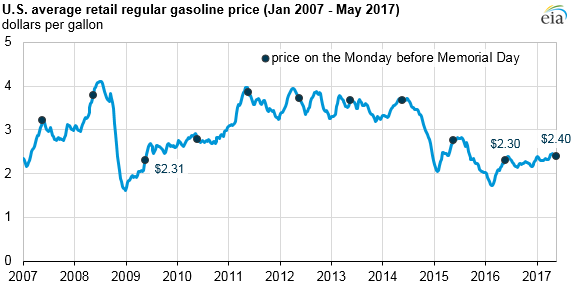
The price of gasoline typically increases during spring as refiners switch from winter-grade to more expensive summer-grade gasoline. Summer-grade gasoline has lower volatility, reducing evaporative emissions that can cause ground-level ozone pollution. This year, unlike in many recent years, prices have remained relatively stable as Memorial Day approaches.
U.S. gasoline prices are more closely tied to Brent crude oil prices than to West Texas Intermediate prices. Brent has been relatively stable in 2017, and weekly average prices have ranged from $48 per barrel (b) to $56/b so far this year. In addition, Brent spot prices have been low compared with recent history and were $23/b below the three-year average as of May 19.
Gasoline demand has also declined since this time last year. As of May 19, the four-week average U.S. gasoline demand is 9.4 million barrels per day, about 2% lower than the level this time last year. Despite declining demand in 2017 so far, AAA (in association with IHS Markit) expects more than 39 million Americans to travel this weekend, 1 million more travelers than last year and the highest travel volume since 2005.
High inventories, including finished gasoline and gasoline blending components, are also contributing to lower gasoline prices. Gasoline inventories have been averaging near or briefly surpassing 2016 levels, which were relatively high for that time of year. Refinery and blender net production of finished motor gasoline has been equal to or greater than 2016 four-week average levels for 10 straight weeks.
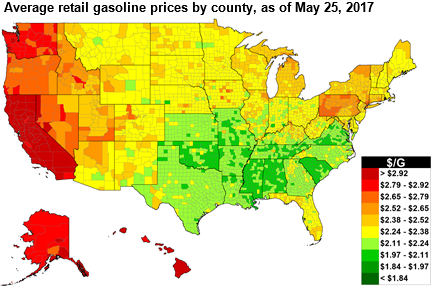
Retail gasoline prices vary significantly within the United States because of regional supply and demand balances, gasoline specification requirements, and taxes. The Gulf Coast (Petroleum Administration for Defense District, or PADD, 3), which has approximately 50% of U.S. refining capacity and produces more gasoline than it consumes, typically has the lowest retail gasoline prices in the country. West Coast (PADD 5) retail gasoline prices are often above the average U.S. price because of the region's tight supply and demand balance, isolation from additional supply sources, and gasoline specifications that are more costly to meet. Average Gulf Coast and West Coast prices are, respectively, 25 cents/gal below and 53 cent/gal above the national average price.
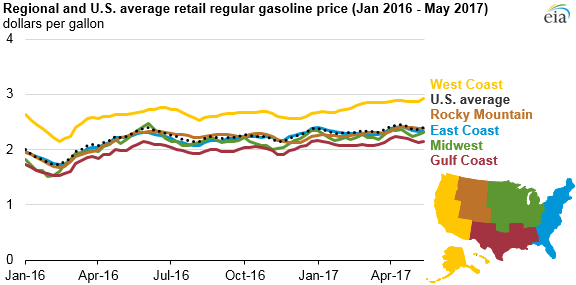
Through May 22, U.S. regular gasoline prices, as measured in EIA's weekly retail survey, have averaged $2.36/gal in 2017. EIA expects the 2017 summer season (April through September) gasoline price to average $2.39/gal, 16 cents higher than last summer. On an annual basis, U.S. regular gasoline prices are forecast to average $2.34/gal in 2017 and $2.45/gal in 2018.
Principal contributor: Matthew French
Tags: Brent, gasoline, Gulf Coast, liquid fuels, oil/petroleum, prices, West Coast