
U.S. ENERGY INFORMATION ADMINISTRATION
WASHINGTON DC 20585
FOR IMMEDIATE RELEASE
November 17, 2021
EIA analysis projects carbon fees would decrease U.S. carbon dioxide emissions through 2050
Carbon fees as high as $35 per metric ton could decrease U.S. energy-related carbon dioxide (CO2) emissions by as much as 19% compared to 2020 levels, according to analysis from the U.S. Energy Information Administration (EIA). In its Analysis of Carbon Fee Runs Using the Annual Energy Outlook 2021, EIA projects that U.S. energy-related CO2 emissions would decrease the most in the first 5–10 years but decrease at a significantly slower rate beyond that period.
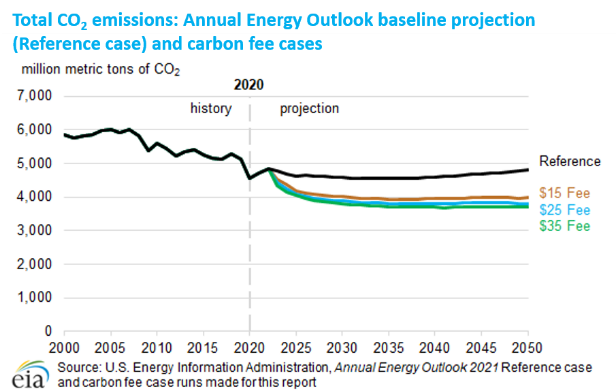
A carbon fee is a tax implemented on the sale of fossil fuels based on the amount of CO2 emissions those fuels generate. EIA considered three levels of carbon fees for its analysis, starting in 2023 at about $15, $25, and $35 per metric ton of CO2. The fees would grow by 5% each year through 2050.
“In all the cases we considered, carbon fees would have a significant initial impact on CO2 emissions, though we do not see significant additional reductions after the first decade,” said EIA Acting Administrator Steve Nalley.
EIA projected in its Annual Energy Outlook 2021 that following the pandemic, U.S. energy-related CO2 emissions would decrease through 2035 before leveling off and then increasing 5% over 2020 levels by 2050. EIA projects that with about a $15 carbon fee (which would increase to more than $56 in 2050), U.S. energy-related CO2 emissions would decrease 13% by 2050 over 2020 levels. About a $25 carbon fee (more than $94 in 2050) would create a 17% decrease, and an approximate $35 carbon fee (almost $132 in 2050) would create a 19% decrease over the same period.
EIA’s analysis finds carbon fees would have downstream effects on the energy sector beyond emissions. For example, existing U.S. nuclear power capacity would be less likely to retire, while renewable energy capacity would increase more rapidly.
“The U.S. electric power sector is most responsive to the carbon fees in our projections, as coal would lose market share to less carbon-intensive options such as natural gas and renewables,” Nalley said. “We project that 280 gigawatts of additional renewable energy capacity would come online by 2050 with a carbon fee compared to our baseline projections.”
The full Analysis of Carbon Fee Runs Using the Annual Energy Outlook 2021 and the Annual Energy Outlook 2021 are available on the EIA website.
EIA Press Contact: Chris Higginbotham, EIAMedia@eia.gov