Today in Energy
Recent Today in Energy analysis of natural gas markets is available on the EIA website.
Market Highlights:
(For the week ending Wednesday, April 9, 2025)Prices
- Henry Hub spot price: The Henry Hub spot price fell 62 cents from $4.05 per million British thermal units (MMBtu) last Wednesday to $3.43/MMBtu yesterday.
- Henry Hub futures price: The price of the May 2025 NYMEX contract decreased 24 cents, from $4.055/MMBtu last Wednesday to $3.816/MMBtu yesterday. The price of the 12-month strip averaging May 2025 through April 2026 futures contracts declined 29 cents to $4.267/MMBtu.
- Select regional spot prices: Natural gas spot prices fell at most major pricing locations this report week (Wednesday, April 2, to Wednesday, April 9). Price changes ranged from a decrease of $1.01 at SoCal Citygate to an increase of 18 cents at Algonquin Citygate.
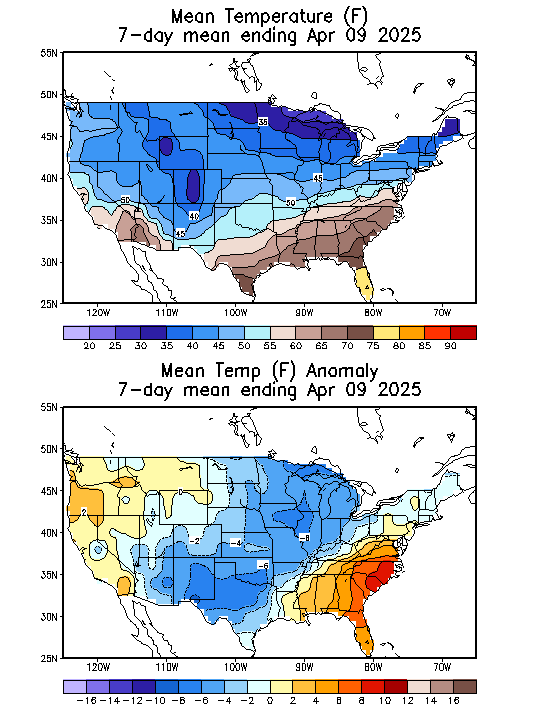
- Prices increased in the Northeast this week as temperatures fell toward the end of the report week and natural gas consumption rose. At the Algonquin Citygate, which serves Boston-area consumers, the price rose 18 cents from $3.35/MMBtu last Wednesday to $3.53/MMBtu yesterday. At the Transco Zone 6 NY trading point for New York City, the price increased 9 cents from $3.17/MMBtu last Wednesday to $3.26/MMBtu yesterday. Temperatures in the Boston Area generally fell at the end of the report week, reaching a daily minimum of 28°F yesterday. Temperatures averaged 39°F the last three days of the report week, compared with 50°F the first four days of the week, or 7°F below normal, resulting in 78 heating degree days (HDD), 20 more HDDs than normal. Temperatures in the New York-Central Park Area followed a similar trend, averaging 42°F the last three days of the report week, or 9°F below normal, resulting in 27 more HDDs than normal. Natural gas consumption in the Northeast increased by 14% (2.5 billion cubic feet per day [Bcf/d]) this report week, according to S&P Global Commodity Insights.
- In the Midwest, the Chicago Citygate price decreased 48 cents from $3.65/MMBtu last Wednesday to $3.17/MMBtu yesterday despite an increase in natural gas consumption. Temperatures in the Chicago Area averaged 42°F this report week, 10°F lower than the previous report week and 5°F below normal, resulting in 162 HDDs, 69 more HDDs than last week and 29 more than normal. Natural gas consumption in the Midwest increased by 21% (2.5 Bcf/d) this report week, according to data from S&P Global Commodity Insights. Natural gas deliveries from the Lower Midcontinent region to the Midwest increased by 27% (0.6 Bcf/d), according to data from S&P Global Commodity Insights. At the same time, net imports from Canada into the Midwest increased to average 1.0 Bcf/d compared with 0.2 Bcf/d of net exports from the Midwest to Canada last report week, according to S&P Global Commodity Insights.
- Prices in California decreased this report week as temperatures rose toward the end of the week. The price at SoCal Citygate in Southern California decreased $1.01 from $3.76 last Wednesday to $2.75/MMBtu yesterday. At PG&E Citygate in Northern California, the price fell 48 cents from $3.02/MMBtu last Wednesday to $2.54/MMBtu yesterday. Temperatures in the Riverside Area, east of Los Angeles, averaged 64°F this report week, resulting in 14 fewer HDDs than normal and 4 more cooling degree days than normal. Temperatures in the Sacramento Area averaged 59°F this week, 5°F more than the previous week and essentially normal for this time of year. Natural gas consumption in the residential and commercial sector in California decreased by 13% (0.3 Bcf/d), according to S&P Global Commodity Insights.
- At Northwest Sumas on the Canada-Washington border, the main pricing point for natural gas in the Pacific Northwest, the price decreased 59 cents from $1.40/MMBtu last Wednesday to $0.81/MMBtu yesterday. Natural gas consumption in the Pacific Northwest was essentially unchanged this report week, while net natural gas imports from Canada increased by 13% (0.4 Bcf/d), according to S&P Global Commodity Insights.
- International futures prices: International natural gas futures prices decreased this report week. According to Bloomberg Finance, L.P., weekly average front-month futures prices for liquefied natural gas (LNG) cargoes in East Asia decreased 30 cents to a weekly average of $12.85/MMBtu. Natural gas futures for delivery at the Title Transfer Facility (TTF) in the Netherlands decreased $1.34 to a weekly average of $11.74/MMBtu. In the same week last year (week ending April 10, 2024), the prices were $9.57/MMBtu in East Asia and $8.58/MMBtu at TTF.
- Natural gas plant liquids (NGPL) prices: The natural gas plant liquids composite price at Mont Belvieu, Texas, fell by 97 cents/MMBtu, averaging $7.12/MMBtu for the week ending April 9. Ethane prices fell 4% week over week, while weekly average natural gas prices at the Houston Ship Channel increased 7%, narrowing the ethane premium to natural gas by 38%. The ethylene spot price fell 16% week over week, and the ethylene premium to ethane decreased 24%. Propane prices decreased 10%, while Brent crude oil prices decreased 12% week over week, narrowing the propane discount to crude oil by 17%. Normal butane and isobutane prices each fell 12%, and natural gasoline prices fell 14%.
Daily spot prices by region are available on the EIA website.
Supply and Demand
- Supply: According to data from S&P Global Commodity Insights, the average total supply of natural gas rose by 2.0% (2.2 Bcf/d) compared with the previous report week. Dry natural gas production grew by 0.5% (0.5 Bcf/d) to average 105.8 Bcf/d, and average net imports from Canada increased by 35.8% (1.7 Bcf/d) from last week.
- Demand: Total U.S. consumption of natural gas rose by 9.3% (6.7 Bcf/d) compared with the previous report week, according to data from S&P Global Commodity Insights. Consumption in the residential and commercial sector increased by 18.9% (3.9 Bcf/d) week over week as cooler temperatures moved into the central United States. Natural gas consumed for power generation rose by 8.0% (2.2 Bcf/d), and consumption in the industrial sector increased by 2.3% (0.5 Bcf/d). Natural gas exports to Mexico decreased 2.1% (0.1 Bcf/d). Natural gas deliveries to U.S. LNG export facilities (LNG pipeline receipts) averaged 16.6 Bcf/d, or 0.4 Bcf/d higher than last week.
Liquefied Natural Gas (LNG)
- Pipeline receipts: Average natural gas deliveries to U.S. LNG export terminals increased 0.4 Bcf/d from last week to 16.6 Bcf/d, according to data from S&P Global Commodity Insights. Natural gas deliveries to terminals in South Louisiana increased 1.9% (0.2 Bcf/d) to 10.8 Bcf/d, and natural gas deliveries to terminals in South Texas increased by 4.3% (0.2 Bcf/d) to 4.7 Bcf/d. Natural gas deliveries to terminals outside the Gulf Coast were essentially unchanged at 1.2 Bcf/d this week.
- Vessels departing U.S. ports: Thirty LNG vessels (eight from Sabine Pass; five from Freeport; four each from Cameron, Corpus Christi, and Plaquemines; three from Calcasieu Pass; and one each from Cove Point and Elba Island) with a combined LNG-carrying capacity of 113 Bcf departed the United States between April 3 and April 9, according to shipping data provided by Bloomberg Finance, L.P.
- In our April Short-Term Energy Outlook, we estimate that U.S. LNG exports set an all-time monthly record high in March 2025 at an average of 15.0 Bcf/d. The increase in exports is primarily the result of the fast ramp up at the new U.S. export facility Plaquemines LNG Phase 1. We estimate that LNG exports from Plaquemines LNG averaged 1.6 Bcf/d in March 2025, or 118% of Phase 1’s nominal capacity.
Rig Count
- According to Baker Hughes, for the week ending Tuesday, April 1, the natural gas rig count decreased by 7 rigs from a week ago to 96 rigs. The Marcellus dropped one rig, and the Utica dropped six rigs. The number of oil-directed rigs increased by 5 rigs from a week ago to 489 rigs. The Granite Wash added one rig, the Marcellus added three rigs, and the Utica added five rigs. The Cana Woodford dropped one rig, and the Permian dropped three rigs. The total rig count, which includes 5 miscellaneous rigs, now stands at 590 rigs, 30 fewer rigs than last year at this time.
Storage
- Net injections into storage totaled 57 Bcf for the week ending April 4, compared with the five-year (2020–24) average net injections of 17 Bcf and last year's net injections of 16 Bcf during the same week. Working natural gas stocks totaled 1,830 Bcf, which is 40 Bcf (2%) lower than the five-year average and 450 Bcf (20%) lower than last year at this time.
- According to The Desk survey of natural gas analysts, estimates of the weekly net change to working natural gas stocks ranged from net injections of 43 Bcf to 65 Bcf, with a median estimate of 56 Bcf.
See also:
Top
| Spot Prices ($/MMBtu) |
Thu,
03-Apr |
Fri,
04-Apr |
Mon,
07-Apr |
Tue,
08-Apr |
Wed,
09-Apr |
|---|---|---|---|---|---|
| Henry Hub |
4.21
|
4.04
|
3.96
|
3.84
|
3.43
|
| New York |
3.28
|
3.45
|
3.93
|
3.79
|
3.26
|
| Chicago |
3.70
|
3.68
|
3.53
|
3.49
|
3.17
|
| Cal. Comp. Avg.* |
2.65
|
2.26
|
2.31
|
2.27
|
2.12
|
| *Avg. of NGI's reported prices for: Malin, PG&E Citygate, and Southern California Border Avg. | |||||
| Data source: NGI's Daily Gas Price Index | |||||

| U.S. natural gas supply - Gas Week: (4/3/25 - 4/9/25) | |||
|---|---|---|---|
Average daily values (billion cubic feet) |
|||
this week |
last week |
last year |
|
| Marketed production | 119.6 |
118.9 |
114.9 |
| Dry production | 105.8 |
105.3 |
101.9 |
| Net Canada imports | 6.5 |
4.8 |
5.3 |
| LNG pipeline deliveries | 0.0 |
0.0 |
0.1 |
| Total supply | 112.4 |
110.1 |
107.3 |
|
Data source: S&P Global Commodity Insights | |||
| U.S. natural gas consumption - Gas Week: (4/3/25 - 4/9/25) | |||
|---|---|---|---|
Average daily values (billion cubic feet) |
|||
this week |
last week |
last year |
|
| U.S. consumption | 78.6 |
71.9 |
77.7 |
| Power | 30.3 |
28.0 |
28.3 |
| Industrial | 23.6 |
23.1 |
23.7 |
| Residential/commercial | 24.7 |
20.8 |
25.8 |
| Mexico exports | 6.6 |
6.7 |
6.1 |
| Pipeline fuel use/losses | 7.0 |
6.9 |
6.8 |
| LNG pipeline receipts | 16.6 |
16.2 |
12.6 |
| Total demand | 108.8 |
101.7 |
103.2 |
|
Data source: S&P Global Commodity Insights | |||


| Rigs | |||
|---|---|---|---|
Tue, April 01, 2025 |
Change from |
||
|
last week
|
last year
|
||
| Oil rigs |
489
|
1.0%
|
-3.7%
|
| Natural gas rigs |
96
|
-6.8%
|
-12.7%
|
| Note: Excludes any miscellaneous rigs | |||
| Rig numbers by type | |||
|---|---|---|---|
Tue, April 01, 2025 |
Change from |
||
|
last week
|
last year
|
||
| Vertical |
13
|
0.0%
|
8.3%
|
| Horizontal |
529
|
0.0%
|
-5.0%
|
| Directional |
48
|
-4.0%
|
-5.9%
|
| Data source: Baker Hughes Company | |||
| Working gas in underground storage | ||||
|---|---|---|---|---|
Stocks billion cubic feet (Bcf) |
||||
| Region |
2025-04-04 |
2025-03-28 |
change |
|
| East |
296 |
284 |
12 |
|
| Midwest |
373 |
364 |
9 |
|
| Mountain |
165 |
165 |
0 |
|
| Pacific |
206 |
202 |
4 |
|
| South Central |
789 |
758 |
31 |
|
| Total |
1,830 |
1,773 |
57 |
|
|
Data source: U.S. Energy Information Administration Form EIA-912, Weekly Underground Natural Gas Storage Report Note: Totals may not equal sum of components because of independent rounding. | ||||
| Working gas in underground storage | |||||
|---|---|---|---|---|---|
Historical comparisons |
|||||
Year ago 4/4/24 |
5-year average 2020-2024 |
||||
| Region | Stocks (Bcf) |
% change |
Stocks (Bcf) |
% change |
|
| East |
362 |
-18.2 |
326 |
-9.2 |
|
| Midwest |
512 |
-27.1 |
422 |
-11.6 |
|
| Mountain |
165 |
0.0 |
109 |
51.4 |
|
| Pacific |
229 |
-10.0 |
174 |
18.4 |
|
| South Central | 1,011 |
-22.0 |
838 |
-5.8 |
|
| Total | 2,280 |
-19.7 |
1,870 |
-2.1 |
|
| Data source: U.S. Energy Information Administration Form EIA-912, Weekly Underground Natural Gas Storage Report
Note: Totals may not equal sum of components because of independent rounding. |
|||||
| Temperature – heating & cooling degree days (week ending Apr 03) | ||||||||
|---|---|---|---|---|---|---|---|---|
HDDs |
CDDs |
|||||||
| Region | Current total |
Deviation from normal |
Deviation from last year |
Current total |
Deviation from normal |
Deviation from last year |
||
| New England | 155 |
-13 |
12 |
0 |
0 |
0 |
||
| Middle Atlantic | 108 |
-44 |
-30 |
0 |
0 |
0 |
||
| E N Central | 112 |
-45 |
-37 |
0 |
0 |
0 |
||
| W N Central | 134 |
-19 |
-24 |
0 |
-1 |
0 |
||
| South Atlantic | 35 |
-47 |
-29 |
26 |
13 |
11 |
||
| E S Central | 28 |
-49 |
-22 |
12 |
7 |
4 |
||
| W S Central | 13 |
-28 |
-22 |
41 |
27 |
21 |
||
| Mountain | 142 |
6 |
-9 |
1 |
-4 |
1 |
||
| Pacific | 109 |
30 |
6 |
0 |
-2 |
0 |
||
| United States | 95 |
-24 |
-21 |
10 |
5 |
5 |
||
|
Data source: National Oceanic and Atmospheric Administration Note: HDDs=heating degree days; CDDs=cooling degree days | ||||||||
Average temperature (°F)
7-day mean ending Apr 03, 2025

Data source: National Oceanic and Atmospheric Administration
Deviation between average and normal temperature (°F)
7-day mean ending Apr 03, 2025
Data source: National Oceanic and Atmospheric Administration
Monthly U.S. dry shale natural gas production by formation is available in the
Short-Term Energy Outlook.