In the News:
Shale natural gas production in the Appalachian Basin sets records in first half of 2021
Dry natural gas production from shale formations in the Appalachian Basin that spans Pennsylvania, West Virginia, and Ohio has been growing since 2008, and monthly production has recently set new records. Production in the region reached 32.5 billion cubic feet per day (Bcf/d) in December 2020, and has averaged 31.9 Bcf/d during the first half of 2021, the highest average for a six-month period since production began in 2008. The Appalachian Basin contains two shale formations, Marcellus and Utica, which accounted for 34% of all U.S. dry natural gas production in 2021. On its own, the Appalachian Basin would have been the third-largest natural gas producer in the world in the first half of 2021, behind Russia and the rest of the United States.
Record dry natural gas production in the first half of 2021 was made possible by growth in pipeline takeaway capacity that allows natural gas produced in the Appalachian Basin to reach other demand markets, especially in the Midwest. From 2008 to 2020, total pipeline takeaway capacity from the Northeast increased from 4.5 Bcf/d to 24.5 Bcf/d, alleviating some congestion and supporting higher wholesale natural gas prices in the region. Most of the increase in takeaway capacity happened between 2014 and 2020, when pipeline capacity increased by 16.5 Bcf/d, much of which was directed to the Midwest.
Pipeline takeaway capacity from Appalachia to Canada and the Southeast has also increased. Recent expansions of pipeline capacity in the Southeast are supporting growth in exports of U.S. liquefied natural gas, in addition to rising consumption in the industrial and power generation sectors.
Although natural gas pipeline capacity out of the Northeastern United States has grown every year since 2014, the rate of increase has slowed, and recently has not kept pace with growth in regional production. The Mountain Valley Pipeline is the largest natural gas pipeline currently being constructed in the region, and is targeted to enter service in 2022. The pipeline will move natural gas from northwestern West Virginia to southern Virginia, extending the Equitrans transmission system to the Transcontinental Gas Pipeline Company’s Zone 5 compressor station 165 near Gretna, Virginia. It is designed to move 2.0 Bcf/d of natural gas, and is intended to further alleviate pipeline congestion. Pipelines tend to be most full in the region during the late summer when consumption of natural gas within the region is typically at its lowest.
Overview:
(For the week ending Wednesday, September 1, 2021)
- Natural gas spot prices rose at most locations this report week (Wednesday, August 25, to Wednesday, September 1). The Henry Hub spot price rose from $4.01 per million British thermal units (MMBtu) last Wednesday to $4.46/MMBtu yesterday.
- The September 2021 NYMEX contract expired Friday at $4.370/MMBtu, up 47¢/MMBtu from last Wednesday. The October 2021 NYMEX contract price increased to $4.615/MMBtu, up 69¢/MMBtu from last Wednesday to yesterday. The price of the 12-month strip averaging October 2021 through September 2022 futures contracts climbed 41¢/MMBtu to $4.066/MMBtu.
- The net injections to working gas totaled 20 billion cubic feet (Bcf) for the week ending August 27. Working natural gas stocks totaled 2,871 Bcf, which is 17% lower than the year-ago level and 7% lower than the five-year (2016–2020) average for this week.
- The natural gas plant liquids composite price at Mont Belvieu, Texas, rose by 27¢/MMBtu, averaging $9.84/MMBtu for the week ending September 1. Isobutane and natural gasoline prices rose 4%, following the 4% increase in Brent crude oil prices. Normal butane prices increased 5% as exports reached record highs, averaging above 400,000 b/d from January through June 2021, a 26% increase over the same period in 2020. The elevated normal butane exports follow the commissioning of the Repauno Port and Rail Terminal, which includes a new marine export terminal along the Delaware River in New Jersey capable of loading liquefied petroleum gases (LPG—propane, normal butane, and isobutane). The terminal loaded its first vessel at the beginning of the year, and since then, it has been regularly shipping normal butane cargos. Propane prices rose 2% and are still at a premium to crude oil, but the premium narrowed for the second consecutive week. The propane premium to crude oil decreased by 13%, or 6¢/MMBtu, for the week ending September 1. Ethane prices rose above $5.00/MMBtu over the week, increasing by 2%, which is more than the 1% increase in ethylene prices and less than the 11% increase in natural gas prices on the Houston Ship Channel. The ethane premium to natural gas narrowed by 31%, or 33¢/MMBtu, for the week ending September 1.
- According to Baker Hughes, for the report week ending Tuesday, August 24, the natural gas rig count remained flat at 97 rigs. The number of oil-directed rigs rose by 5 rigs to 410 rigs, the highest reported total since mid-April 2020. Oil-directed drilling rig increases were led by the Permian Basin, with a 2-rig increase, and by Wyoming, also with a 2-rig increase. Oklahoma’s Anadarko Basin also added 1 rig. The total rig count increased by 5 rigs, and it now stands at 508 rigs, or 264 rigs (108%) above the August 14, 2020, total of 244 rigs, which was the lowest level in the past 20 years.
Prices/Supply/Demand:
Supply disruption caused by Hurricane Ida results in elevated prices along the U.S. Gulf Coast. This report week (Wednesday, August 25, to Wednesday, September 1), the Henry Hub spot price rose 45¢ from a weekly low of $4.01/MMBtu last Wednesday to a weekly high of $4.46/MMBtu yesterday. The Bureau of Safety and Environmental Enforcement (BSEE) estimates close to 1.9 Bcf/d of natural gas production from the offshore Gulf of Mexico was shut in as of yesterday morning, down slightly from a peak of 2.1 Bcf/d reported on Tuesday morning. This reduced offshore supply by 1.9 Bcf/d on average week over week, according to IHS Markit, from an average of 2.6 Bcf/d last week to 0.7 Bcf/d this week. Hurricane Ida caused significant damage to power transmission infrastructure in Louisiana. Although power outages and shutdowns at industrial facilities throughout the region reduced demand, consumption in the Southeast declined by less than production, falling by 1.0 Bcf/d week over week, according to IHS Markit estimates. Higher prices in the region caused by the supply-demand imbalance led to increased receipts of natural gas from other regions, and pipeline receipts from the Northeast rose on average by 0.3 Bcf/d week over week. IHS estimates flows from the Northeast into the Southeast rose above 9.6 Bcf/d for only the fourth time ever. Prior to 2015, the Northeast was a net recipient of natural gas from the Southeast.
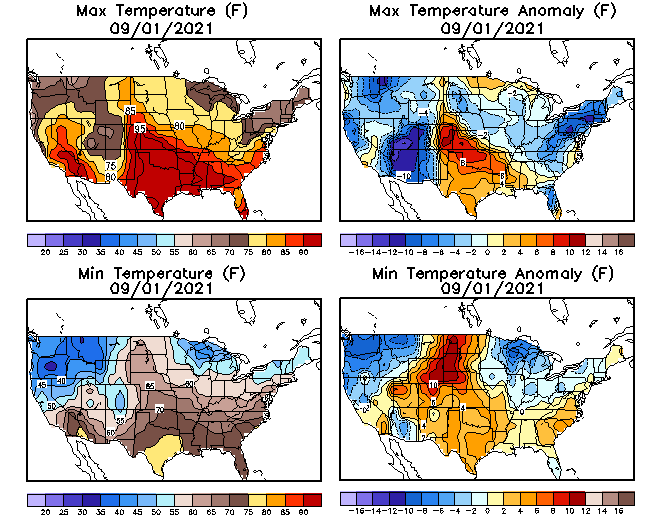
Prices in the Midwest follow Henry Hub upward, as disruptions to Southeast natural gas supply affect the natural gas market. At the Chicago Citygate, the price increased 45¢ from $3.95/MMBtu last Wednesday to $4.40/MMBtu yesterday. The rise in prices occurred despite a general decline in natural gas demand in the region. Temperatures across the Midwest moderated somewhat week over week; temperatures in the Chicago area reached a high of 76ºF yesterday, 4ºF below normal. IHS Markit estimates average weekly natural gas consumption for electric power generation declined by almost 2.4 Bcf/d from last Wednesday (when it exceeded 4.7 Bcf/d for the first time this summer) to yesterday.
Prices in California are mixed, as higher cost of supply is partially offset by lower demand at the end of the week. The price at PG&E Citygate in Northern California rose 63¢, up from $5.20/MMBtu last Wednesday to a weekly high of $5.83/MMBtu yesterday. Prices at hubs where natural gas into the PG&E territory originates went up this report week, reaching their weekly highs yesterday. The price at Sumas on the Canada-Washington border rose 58¢ from $3.82/MMBtu last Wednesday to $4.40/MMBtu yesterday. The price at Opal Hub in southwest Wyoming rose 42¢ from $3.98/MMBtu last Wednesday to $4.40/MMBtu yesterday. The price at Cheyenne Hub in southeast Wyoming rose 51¢ from $3.79/MMBtu last Wednesday to $4.30/MMBtu yesterday.
Prices in Southern California declined this week. The price at SoCal Citygate decreased $1.28/MMBtu from $6.74/MMBtu last Wednesday to $5.46/MMBtu yesterday, after reaching a weekly high of $7.23/MMBtu on Thursday. Prices at the SoCal Citygate remained elevated throughout most of the report week, as natural gas deliveries to SoCal Gas territory remain limited. In addition to the previously reported capacity reductions on El Paso Natural Gas Company’s (EPNG) Line 2000, EPNG declared a force majeure at its Waha Station compressor, which further reduced capacity on the system by approximately 0.3 Bcf/d starting yesterday. Prices began decreasing on Tuesday, and they fell below $6.00/MMBtu yesterday as temperatures in the region moderated and natural gas demand for power generation declined. NOAA reports temperatures in the Riverside area, inland from Los Angeles, averaged 71.5ºF yesterday, almost 8ºF below normal, and 12ºF below Sunday’s average of 83.5ºF. Natural gas demand for power generation demand in California also fell during this period, from an estimated 2.7 Bcf/d on Sunday to 1.9 Bcf/d yesterday.
Prices fall in the Northeast in response to lower temperatures and reduced demand from the electric power generation sector. At the Algonquin Citygate, which serves Boston-area consumers, the price went down 35¢ from $4.32/MMBtu last Wednesday to $3.97/MMBtu yesterday. At the Transcontinental Pipeline Zone 6 trading point for New York City, the price decreased 13¢ from $3.99/MMBtu last Wednesday to $3.86/MMBtu yesterday. Temperatures fell throughout the region yesterday, declining in the New York City area to more than 10ºF below normal. IHS Markit estimates electric power generation demand in the Northeast declined from close to 12.4 Bcf/d last Wednesday to 8.1 Bcf/d yesterday in response to lower electricity demand for air-conditioning, as well as power outages in the region. Public Service Enterprise Group, the largest utility in New Jersey, reports as many as 135,000 customers in its service territory were without power on Wednesday, after the remnants of Hurricane Ida swept through the region.
Prices in the Appalachian Basin reach weekly highs yesterday in response to higher prices in the Southeast and Midwest and increased pipeline flows out of the region. The Tennessee Zone 4 Marcellus spot price increased 14¢ from $3.68/MMBtu last Wednesday to $3.82/MMBtu yesterday. The price at Eastern Gas South in southwest Pennsylvania rose 11¢ from $3.73/MMBtu last Wednesday to $3.84/MMBtu yesterday. IHS Markit estimates westbound flows from the region exceeded 6.2 Bcf/d yesterday, for the first time since late June. Southbound flows also rose to compensate for reduced production in the Gulf of Mexico.
Permian Basin production region prices rise faster than Henry Hub prices. The price at the Waha Hub in West Texas, which is located near Permian Basin production activities, rose 62¢/MMBtu this report week, from $3.68/MMBtu last Wednesday to $4.30/MMBtu yesterday, resulting in a reduced discount relative to the Henry Hub price. The Waha hub traded 33¢/MMBtu below the Henry Hub price last Wednesday, and 16¢/MMBtu lower than the Henry Hub price yesterday. IHS Markit estimates average weekly production in the Permian Basin declined 0.7 Bcf/d week over week, closely following reductions in westbound flows because of the outages on the EPNG system (see California discussion above). The tightened market in the Gulf Coast because of Hurricane Ida resulted in price increases in all regions supplying the Gulf Coast market, resulting in strengthening prices at the Waha hub.
Average U.S. natural gas supply falls week over week. Total average natural gas supply fell by 2.3%, or 2.3 Bcf/d, compared with the previous report week, according to data from IHS Markit. Average dry natural gas production and marketed production decreased by 2.4% and 2.6%, respectively (or 2.2 Bcf/d and 2.8 Bcf/d), driven by a decrease in production from the Gulf of Mexico. Average net imports from Canada were relatively flat at 5.1 Bcf/d, and they remain approximately 0.3 Bcf/d above levels in the same week last year.
Average U.S. natural gas consumption decreases compared with previous report week due to lower demand for electric power generation. Average total U.S. consumption of natural gas fell by 1.4%, or 1.0 Bcf/d, compared with the prior report week. Natural gas demand for power generation fell by 2.3%, or 0.9 Bcf/d, as temperatures moderated near the end of the report week across the central and northeastern United States. The industrial sector and pipeline fuel use decreased by 0.6% and 2.9% (or 0.1 Bcf/d and 0.2 Bcf/d), respectively. Demand in the residential and commercial sector was relatively flat week over week, as were pipeline receipts at liquefied natural gas (LNG) export terminals. Exports to Mexico increased by 4.1%, or 0.2 Bcf/d.
U.S. LNG exports increase week over week. Twenty LNG vessels (six from Sabine Pass, four each from Corpus Christi and Freeport, three from Cameron, two from Cove Point, and one from Elba Island) with a combined LNG-carrying capacity of 73 Bcf departed the United States between August 26 and September 1, 2021, according to shipping data provided by Bloomberg Finance, L.P.
Storage:
The net injections into storage totaled 20 Bcf for the week ending August 27, compared with the five-year (2016–2020) average net injections of 53 Bcf and last year's net injections of 36 Bcf during the same week. Working natural gas stocks totaled 2,871 Bcf, which is 222 Bcf lower than the five-year average and 579 Bcf lower than last year at this time.
According to The Desk survey of natural gas analysts, estimates of the weekly net change to working natural gas stocks ranged from net injections of 13 Bcf to 34 Bcf, with a median estimate of 24 Bcf.
The average rate of injections into storage is 15% lower than the five-year average so far in the refill season (April through October). If the rate of injections into storage matched the five-year average of 9.6 Bcf/d for the remainder of the refill season, the total inventory would be 3,497 Bcf on October 31, which is 222 Bcf lower than the five-year average of 3,719 Bcf for that time of year.
More storage data and analysis can be found on the Natural Gas Storage Dashboard and the Weekly Natural Gas Storage Report.
See also:
 Source: Graph by U.S. Energy Information Administration, based on state administrative data collected by Enverus Drillinginfo Inc.
 Source: U.S. Energy Information Administration, U.S. state-to-state pipeline capacity
state-to-state pipeline capacity.
Source: U.S. Energy Information Administration, U.S. state-to-state pipeline capacity
state-to-state pipeline capacity.

| Spot Prices ($/MMBtu) | Thu, 26-Aug |
Fri, 27-Aug |
Mon, 30-Aug |
Tue, 31-Aug |
Wed, 1-Sep |
|---|---|---|---|---|---|
| Henry Hub | 4.05 | 4.34 | 4.21 | 4.25 | 4.46 |
| New York | 3.99 | 3.83 | 3.98 | 3.85 | 3.86 |
| Chicago | 4.04 | 4.21 | 4.14 | 4.19 | 4.40 |
| Cal. Comp. Avg,* | 5.10 | 5.23 | 5.25 | 5.15 | 5.11 |
| Futures ($/MMBtu) | |||||
| September Contract | 4.184 | 4.370 | Expired | Expired | Expired |
| October Contract | 4.211 | 4.388 | 4.305 | 4.377 | 4.615 |
| November Contract | 4.261 | 4.343 | 4.359 | 4.425 | 4.663 |
*Avg. of NGI's reported prices for: Malin, PG&E Citygate, and Southern California Border Avg. Source: Graph by the U.S. Energy Information Administration (EIA), based on data from Natural Gas Intelligence Daily Gas Price Index |
|||||


| U.S. natural gas supply - Gas Week: (8/26/21 - 9/1/21) | |||
|---|---|---|---|
Average daily values (billion cubic feet) |
|||
this week |
last week |
last year |
|
| Marketed production | 103.0 |
105.8 |
100.0 |
| Dry production | 91.5 |
93.7 |
89.2 |
| Net Canada imports | 5.1 |
5.1 |
4.8 |
| LNG pipeline deliveries | 0.1 |
0.1 |
0.1 |
| Total supply | 96.7 |
98.9 |
94.0 |
|
Source: Chart by the U.S. Energy Information Administration (EIA), based on data from IHS Markit | |||
| U.S. natural gas consumption - Gas Week: (8/26/21 - 9/1/21) | |||
|---|---|---|---|
Average daily values (billion cubic feet) |
|||
this week |
last week |
last year |
|
| U.S. consumption | 68.5 |
69.5 |
69.7 |
| Power | 39.1 |
40.1 |
40.9 |
| Industrial | 20.8 |
20.9 |
20.8 |
| Residential/commercial | 8.6 |
8.5 |
8.0 |
| Mexico exports | 6.3 |
6.1 |
6.3 |
| Pipeline fuel use/losses | 6.3 |
6.5 |
6.2 |
| LNG pipeline receipts | 10.5 |
10.4 |
2.7 |
| Total demand | 91.6 |
92.4 |
84.9 |
|
Source: Chart by the U.S. Energy Information Administration (EIA), based on data from IHS Markit | |||


| Rigs | |||
|---|---|---|---|
Tue, August 24, 2021 |
Change from |
||
last week |
last year |
||
| Oil rigs | 410 |
1.2% |
127.8% |
| Natural gas rigs | 97 |
0.0% |
34.7% |
| Note: Excludes any miscellaneous rigs | |||
| Rig numbers by type | |||
|---|---|---|---|
Tue, August 24, 2021 |
Change from |
||
last week |
last year |
||
| Vertical | 21 |
10.5% |
61.5% |
| Horizontal | 459 |
1.1% |
107.7% |
| Directional | 28 |
-6.7% |
40.0% |
| Source: Chart by the U.S. Energy Information Administration (EIA), based on data from Baker Hughes Company | |||
| Working gas in underground storage | ||||
|---|---|---|---|---|
Stocks billion cubic feet (Bcf) |
||||
| Region | 2021-08-27 |
2021-08-20 |
change |
|
| East | 678 |
661 |
17 |
|
| Midwest | 812 |
790 |
22 |
|
| Mountain | 190 |
188 |
2 |
|
| Pacific | 243 |
241 |
2 |
|
| South Central | 948 |
970 |
-22 |
|
| Total | 2,871 |
2,851 |
20 |
|
|
Source: U.S. Energy Information Administration Form EIA-912, Weekly Underground Natural Gas Storage Report | ||||
| Working gas in underground storage | |||||
|---|---|---|---|---|---|
Historical comparisons |
|||||
Year ago (8/27/20) |
5-year average (2016-2020) |
||||
| Region | Stocks (Bcf) |
% change |
Stocks (Bcf) |
% change |
|
| East | 787 |
-13.9 |
738 |
-8.1 |
|
| Midwest | 921 |
-11.8 |
834 |
-2.6 |
|
| Mountain | 212 |
-10.4 |
195 |
-2.6 |
|
| Pacific | 304 |
-20.1 |
287 |
-15.3 |
|
| South Central | 1,225 |
-22.6 |
1,039 |
-8.8 |
|
| Total | 3,450 |
-16.8 |
3,093 |
-7.2 |
|
| Source: U.S. Energy Information Administration Form EIA-912, Weekly Underground Natural Gas Storage Report | |||||
| Temperature – heating & cooling degree days (week ending Aug 26) | ||||||||
|---|---|---|---|---|---|---|---|---|
HDDs |
CDDs |
|||||||
| Region | Current total |
Deviation from normal |
Deviation from last year |
Current total |
Deviation from normal |
Deviation from last year |
||
| New England | 0 |
-6 |
-2 |
75 |
49 |
29 |
||
| Middle Atlantic | 0 |
-4 |
-1 |
82 |
43 |
21 |
||
| E N Central | 0 |
-7 |
-4 |
83 |
45 |
29 |
||
| W N Central | 3 |
-6 |
2 |
77 |
26 |
9 |
||
| South Atlantic | 0 |
-1 |
0 |
108 |
23 |
16 |
||
| E S Central | 0 |
-1 |
0 |
107 |
27 |
30 |
||
| W S Central | 0 |
0 |
0 |
134 |
19 |
22 |
||
| Mountain | 6 |
-6 |
6 |
59 |
-6 |
-39 |
||
| Pacific | 4 |
-1 |
3 |
29 |
-13 |
-49 |
||
| United States | 1 |
-4 |
0 |
84 |
23 |
7 |
||
|
Source: Chart by the U.S. Energy Information Administration (EIA), based on data from the National Oceanic and Atmospheric Administration Note: HDDs=heating degree days; CDDs=cooling degree days | ||||||||
Average temperature (°F)
7-day mean ending Aug 26, 2021

Source: National Oceanic and Atmospheric Administration
Deviation between average and normal (°F)
7-day mean ending Aug 26, 2021
Source: National Oceanic and Atmospheric Administration
