In the News:
Alaska is a major natural gas producer, but little of the natural gas reaches market
Alaska is the third-largest natural gas producer in the United States after Texas and Pennsylvania, but producers in Alaska reinject more of that natural gas back into the ground than in any other state. Because of falling natural gas production in natural gas fields close to Alaska’s main consumption center, in and around Anchorage, the state is exploring ways of moving some of the natural gas currently being reinjected in the north to consumers in the south, and potentially, to export markets overseas.
In 2019, Alaska’s natural gas gross withdrawals averaged 8.9 billion cubic feet per day (Bcf/d), 98% of which came from oil wells. To maintain optimum reservoir pressure for continued crude oil production, 90% of that natural gas was reinjected into oil-bearing formations (primarily into the Prudhoe Bay oilfield on the North Slope of Alaska). This natural gas recycling in Alaska accounts for 82% of all natural gas reinjected back into existing reservoirs in the entire United States.
With proven dry natural gas reserves totaling 9,297 Bcf, Alaska had an average annual consumption among non-energy sector end-use consumers of 0.2 Bcf/d as of 2019, which represents a small fraction of the economically viable natural gas reserves consumed in Alaska each year. In 2020, the United States Geological Survey (USGS) updated its Alaska natural gas resource estimate, adding a further 8,942 Bcf in natural gas resources in the central region of the North Slope of Alaska.
Over the past 7 years, the highest non-energy sector end use of natural gas has been for electric generation, followed by the residential and commercial sectors. Historically, the industrial sector has consumed the least natural gas. However, over the past 3 years, natural gas consumption in the industrial sector has been increasing more than in other sectors, rising from less than 10% of total natural gas consumption in 2017 to more than 21% in 2020. The energy sector end-use consumers have a higher total consumption of natural gas overall. In 2019, the last year for which data is available, total consumption of natural gas by oil and natural gas industry activities in Alaska accounted for 78% of total marketed consumption. In states like Texas and Pennsylvania this number was 12% and 18% respectively.
Natural gas delivered to Alaska’s consumers originates primarily from the Cook Inlet and the Kenai Peninsula. When discovered, the resources identified in these two areas exceeded Alaska’s demand, so the two lead developers, Phillips Petroleum Company and The Ohio Company (now known as Marathon Petroleum) proposed, and received approval, to export surplus production as liquefied natural gas (LNG). In the fall of 1969, the Kenai LNG liquefaction facility shipped its first cargo to Japan, becoming the first supplier of LNG to Asia and one of the first LNG exporters in the world. Until 2012, the Kenai LNG plant was the only such facility in the United States authorized to export natural gas overseas.
Because production in the Cook Inlet and the Kenai Peninsula is declining, the Kenai LNG plant ceased producing LNG in 2015, and its operators have sought authorization to import LNG to ensure continuous supply to Anchorage-area consumers. The state government has also proposed to build, with private-sector partners, a natural gas pipeline from Alaska’s North Slope to the south. The Alaska Gasline natural gas pipeline would deliver natural gas first to the Fairbanks area, where petroleum is used as the primary fuel for heating and power generation, and eventually to Anchorage, where the natural gas would supplement declining in-region production and allow for a restart of LNG exports from a proposed new 2.55 Bcf/d export terminal. The Alaska LNG terminal received final export authorization from the Federal Energy Regulatory Commission in May 2020.
Overview:
(For the week ending Wednesday, May 26, 2021)
- Natural gas spot price movements were mixed this report week (Wednesday, May 19 to Wednesday, May 26). The Henry Hub spot price remained flat at $2.88 per million British thermal units (MMBtu).
- The June 2021 NYMEX contract expired yesterday at $2.984/MMBtu, up 2¢/MMBtu from last Wednesday. The July 2021 contract price remained unchanged Wednesday to Wednesday at $3.027/MMBtu. The price of the 12-month strip averaging July 2021 through June 2022 futures contracts climbed 1¢/MMBtu to $3.004/MMBtu.
- The net injections to working gas totaled 115 billion cubic feet (Bcf) for the week ending May 21. Working natural gas stocks totaled 2,215 Bcf, which is 15% lower than the year-ago level and 3% lower than the five-year (2016–2020) average for this week.
- The natural gas plant liquids composite price at Mont Belvieu, Texas, rose by 7¢/MMBtu, averaging $7.68/MMBtu for the week ending May 26. The price of ethane was relatively flat, falling 1% week over week. The prices of propane, butane, and isobutane all rose by 2%, reflecting relative tightness in the market as product supplied, and exports remained elevated for this time of year. Average weekly natural gasoline prices fell 2% week over week, in line with the decline in the Brent crude oil price, which also fell 2%.
- According to Baker Hughes, for the week ending Tuesday, May 18, the natural gas rig count decreased by 1 to 99. After strong gains in the past six months, the Haynesville play lost one rig in Louisiana for the second week in a row. The Haynesville play is still the only natural gas-oriented play in the United States to record a rig count above year-ago levels. The number of oil-directed rigs rose by 4 to 356. The gains were equally split between the Anadarko Basin in Oklahoma and the New Mexico portion of the Permian Basin. The total rig count increased by 2, and it now stands at 455, which is 137 higher than the same week last year.
Prices/Supply/Demand:
Prices at major U.S. hubs were varied, reflecting mixed weather across the country this report week (Wednesday, May 19 to Wednesday, May 26). The Henry Hub spot price remained within a 10¢/MMBtu range throughout the week, falling as low at $2.78/MMBtu on Tuesday but ending the week on par with last Wednesday at $2.88/MMBtu yesterday—a weekly high.
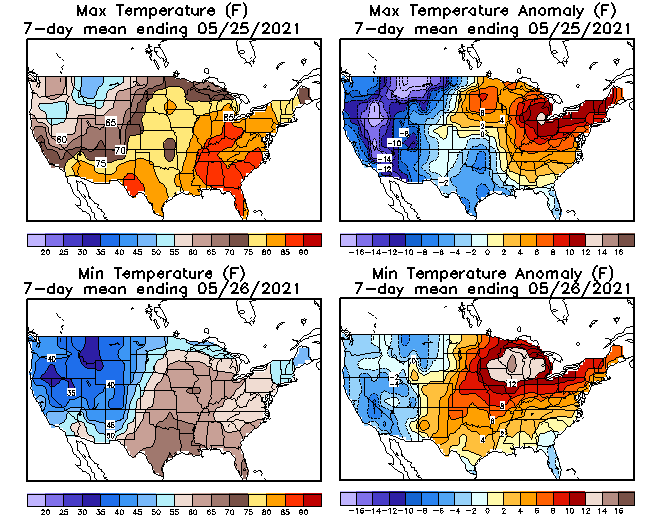
Midwest prices are relatively flat as warmer weather leads to reduced heating demand and increased power generation. IHS Markit reports a 38% week-on-week decline in Midwest residential and commercial sector natural gas consumption, largely offset by a 36% increase in natural gas consumption for power generation. Temperatures in Chicago averaged in the high 70’s throughout the week, approximately 10°F above normal. Chicago registered a weekly high of 90°F on Monday, 16°F above normal. At the Chicago Citygate, the price increased 1¢ from $2.80/MMBtu last Wednesday to a weekly high of $2.81/MMBtu yesterday, after falling to a weekly low of $2.71/MMBtu on Monday.
California prices are mixed as weather and storage maintenance continue to pull prices in opposite directions. The price at PG&E Citygate in Northern California fell 21¢, down from $3.96/MMBtu last Wednesday to a weekly low of $3.75/MMBtu yesterday. Prices in all regions supplying the PG&E declined this week. The price at Malin, Oregon, on the Oregon-California border, fell 5¢/MMBtu from $2.81/MMBtu last Wednesday to $2.76/MMBtu yesterday. The price at Sumas on the Canada-Washington border fell 8¢ from $2.77/MMBtu last Wednesday to $2.69/MMBtu yesterday. The price at Opal Hub in southwest Wyoming, the main trading point for natural gas in the Rocky Mountain region and the origin point for deliveries into the California market through the Ruby Pipeline, fell 6¢ from $2.76/MMBtu last Wednesday to $2.70/MMBtu yesterday.
The price at SoCal Citygate in Southern California increased 86¢ from $3.24/MMBtu last Wednesday to $4.10/MMBtu yesterday. The price fell to a weekly low of $3.01/MMBtu on Friday before rising rapidly to $3.91/MMBtu on Monday. SoCalGas reports impairments to storage field injections across its network totaling 430 million cubic feet per day (MMcf/d). The impairments are down from 810 MMcf/d last week because annual maintenance at the Aliso Canyon storage facility was completed on Monday. The maintenance, which lasted from May 9 to May 24, reduced the ability of SoCalGas to inject natural gas into the storage field by 545 MMcf/d. Once this maintenance was completed, more natural gas began flowing into storage, and therefore, provided an outlet for excess natural gas volumes to balance the market, which was not available when this storage field was under maintenance.
Prices in the Northeast fall, even as demand for natural gas for power generation rises. Temperatures across the Northeast set or approached records for this time of year, pushing up power demand as the air conditioning season arrived well ahead of seasonal averages. Temperatures in Augusta, Maine, set an all-time-high of 92°F yesterday, 4°F above the previous record set in 2010 and 23°F above normal for this time of year. The maximum temperature in Boston yesterday was 92°F, which is 23°F above normal and just 4°F below the all-time high of 97°F set in 1880. IHS Markit estimates natural gas demand in the Northeast exceeded 9.5 billion cubic feet per day (Bcf/d) yesterday, the highest level since late summer of last year. Week over week, however, total natural gas demand increased only slightly because declines in demand in the residential and commercial sector mostly offset increased demand for electricity generation. At the Algonquin Citygate, which serves Boston-area consumers, the price went down 16¢ from $2.46/MMBtu last Wednesday to $2.30/MMBtu yesterday. Prices rose as high as $2.53/MMBtu on Tuesday in advance of expected record-setting temperatures. At the Transcontinental Pipeline Zone 6 trading point for New York City, the price decreased 7¢ from $2.48/MMBtu last Wednesday to $2.41/MMBtu yesterday, after peaking on Tuesday at $2.50/MMBtu.
Prices in the Appalachia Basin production region are mixed. The Tennessee Zone 4 Marcellus spot price increased 4¢ from $2.01/MMBtu last Wednesday to a weekly high of $2.05/MMBtu yesterday after reaching a weekly low of $1.85/MMBtu on Friday. The price at Dominion South in southwest Pennsylvania fell 6¢ from $2.29/MMBtu last Wednesday to $2.23/MMBtu yesterday after reaching a weekly high of $2.32/MMBtu on Friday.
Prices throughout the Permian Basin decline week over week as natural gas flows out of the basin approach record levels. IHS Markit estimates natural gas flows out of the Permian Basin last week averaged just under 12 Bcf/d and exceeded 12 Bcf/d Friday through Sunday. High production levels, along with natural gas outflows that approached pipeline capacity levels, resulted in significant price declines week over week. The price at the Waha Hub in West Texas, which is located near Permian Basin production activities, fell 25¢/MMBtu from $2.76/MMBtu last Wednesday to $2.51/MMBtu yesterday. The Waha Hub price is now at a 37¢/MMBtu discount relative to the Henry Hub price, compared to a 12¢/MMBtu discount last Wednesday.
U.S. production of natural gas tops 92 Bcf/d. According to data from IHS Markit, the average total supply of natural gas rose by 0.4% compared with the previous report week. Dry natural gas production grew by 0.7% compared with the previous report week to 92.4 Bcf/d. At close to 93 Bcf/d, IHS Markit estimated production on Sunday was the highest since mid-April 2020. Average net imports from Canada decreased slightly by 0.2% from last week.
Early summer heat increases power generation. Total U.S. consumption of natural gas rose by 2.8% compared with the previous report week, which was led by consumption in the power sector, according to data from IHS Markit. Natural gas consumed for power generation climbed by 15.4% week over week as higher than normal temperatures in the East and Midwest increased cooling demand. Industrial sector consumption decreased by 3.1% week over week. In the residential and commercial sectors, consumption declined by 17.1% due to low heating demand for most of the country. Natural gas exports to Mexico increased 1.3% to 6.2 Bcf/d. Natural gas deliveries to U.S. liquefied natural gas (LNG) export facilities (LNG pipeline receipts) averaged 10.5 Bcf/d, or 0.22 Bcf/d higher than last week.
U.S. LNG exports decrease week over week, reflecting lower feed gas deliveries into LNG liquefaction facilities the prior week. Eighteen LNG vessels (seven from Sabine Pass, four from Cameron, three each from Corpus Christi and Freeport, and one from Cove Point) with a combined LNG-carrying capacity of 67 Bcf departed the United States between May 20 and May 26, according to shipping data provided by Bloomberg Finance, L.P.
Storage:
The net injections into storage totaled 115 Bcf for the week ending May 21, compared with the five-year (2016–2020) average net injections of 91 Bcf and last year's net injections of 105 Bcf during the same week. Working natural gas stocks totaled 2,215 Bcf, which is 63 Bcf lower than the five-year average and 381 Bcf lower than last year at this time.
According to The Desk survey of natural gas analysts, estimates of the weekly net change to working natural gas stocks ranged from net injections of 96 Bcf to 111 Bcf, with a median estimate of 106 Bcf.
More storage data and analysis can be found on the Natural Gas Storage Dashboard and the Weekly Natural Gas Storage Report.
See also:

 Source: U.S. Energy Information Administration, Natural Gas Consumption By End Use

| Spot Prices ($/MMBtu) | Thu, 20-May |
Fri, 21-May |
Mon, 24-May |
Tue, 25-May |
Wed, 26-May |
|---|---|---|---|---|---|
| Henry Hub |
2.85 |
2.81 |
2.78 |
2.84 |
2.88 |
| New York |
2.44 |
2.49 |
2.46 |
2.50 |
2.41 |
| Chicago |
2.77 |
2.74 |
2.71 |
2.78 |
2.81 |
| Cal. Comp. Avg.* |
3.18 |
3.05 |
3.23 |
3.16 |
3.13 |
| Futures ($/MMBtu) | |||||
| June contract | 2.925 |
2.906 |
2.886 |
2.913 |
2.984 |
| July contract |
2.991 |
2.977 |
2.960 |
2.974 |
3.027 |
| *Avg. of NGI's reported prices for: Malin, PG&E Citygate, and Southern California Border Avg. | |||||
| Source: NGI's Daily Gas Price Index | |||||


| U.S. natural gas supply - Gas Week: (5/20/21 - 5/26/21) | |||
|---|---|---|---|
Average daily values (billion cubic feet) |
|||
this week |
last week |
last year |
|
| Marketed production | 104.6 |
103.9 |
94.8 |
| Dry production | 92.4 |
91.8 |
84.9 |
| Net Canada imports | 4.5 |
4.5 |
3.7 |
| LNG pipeline deliveries | -0.2 |
0.0 |
0.1 |
| Total supply | 96.7 |
96.3 |
88.7 |
|
Source: IHS Markit | |||
| U.S. natural gas consumption - Gas Week: (5/20/21 - 5/26/21) | |||
|---|---|---|---|
Average daily values (billion cubic feet) |
|||
this week |
last week |
last year |
|
| U.S. consumption | 59.9 |
58.2 |
57.6 |
| Power | 30.5 |
26.5 |
27.6 |
| Industrial | 20.7 |
21.4 |
19.8 |
| Residential/commercial | 8.6 |
10.4 |
10.2 |
| Mexico exports | 6.2 |
6.1 |
4.9 |
| Pipeline fuel use/losses | 6.1 |
6.1 |
5.8 |
| LNG pipeline receipts | 10.5 |
10.3 |
5.9 |
| Total demand | 82.7 |
80.6 |
74.1 |
|
Source: IHS Markit | |||


| Rigs | |||
|---|---|---|---|
Tue, May 18, 2021 |
Change from |
||
last week |
last year |
||
| Oil rigs | 356 |
1.1% |
50.2% |
| Natural gas rigs | 99 |
-1.0% |
25.3% |
| Note: Excludes any miscellaneous rigs | |||
| Rig numbers by type | |||
|---|---|---|---|
Tue, May 18, 2021 |
Change from |
||
last week |
last year |
||
| Vertical | 15 |
0.0% |
87.5% |
| Horizontal | 412 |
0.5% |
44.6% |
| Directional | 28 |
0.0% |
12.0% |
| Source: Baker Hughes Co. | |||
| Working gas in underground storage | ||||
|---|---|---|---|---|
Stocks billion cubic feet (Bcf) |
||||
| Region | 2021-05-21 |
2021-05-14 |
change |
|
| East | 385 |
358 |
27 |
|
| Midwest | 499 |
472 |
27 |
|
| Mountain | 144 |
135 |
9 |
|
| Pacific | 256 |
247 |
9 |
|
| South Central | 931 |
888 |
43 |
|
| Total | 2,215 |
2,100 |
115 |
|
| Source: Form EIA-912, Weekly Underground Natural Gas Storage Report | ||||
| Working gas in underground storage | |||||
|---|---|---|---|---|---|
Historical comparisons |
|||||
Year ago (5/21/20) |
5-year average (2016-2020) |
||||
| Region | Stocks (Bcf) |
% change |
Stocks (Bcf) |
% change |
|
| East | 499 |
-22.8 |
419 |
-8.1 |
|
| Midwest | 602 |
-17.1 |
497 |
0.4 |
|
| Mountain | 131 |
9.9 |
134 |
7.5 |
|
| Pacific | 262 |
-2.3 |
245 |
4.5 |
|
| South Central | 1,102 |
-15.5 |
983 |
-5.3 |
|
| Total | 2,596 |
-14.7 |
2,278 |
-2.8 |
|
| Source: Form EIA-912, Weekly Underground Natural Gas Storage Report | |||||
| Temperature – heating & cooling degree days (week ending May 20) | ||||||||
|---|---|---|---|---|---|---|---|---|
HDD deviation from: |
CDD deviation from: |
|||||||
| Region | HDD Current |
normal |
last year |
CDD Current |
normal |
last year |
||
| New England | 27 |
-31 |
-38 |
1 |
0 |
1 |
||
| Middle Atlantic | 24 |
-21 |
-24 |
7 |
2 |
5 |
||
| E N Central | 35 |
-16 |
-17 |
10 |
-2 |
8 |
||
| W N Central | 30 |
-14 |
-23 |
11 |
-4 |
9 |
||
| South Atlantic | 25 |
7 |
7 |
36 |
-5 |
-10 |
||
| E S Central | 18 |
2 |
7 |
30 |
-1 |
-11 |
||
| W S Central | 5 |
2 |
2 |
45 |
-13 |
-23 |
||
| Mountain | 39 |
-19 |
1 |
23 |
2 |
2 |
||
| Pacific | 37 |
0 |
-1 |
0 |
-7 |
0 |
||
| United States | 28 |
-10 |
-10 |
19 |
-3 |
-2 |
||
|
Note: HDD = heating degree day; CDD = cooling degree day Source: National Oceanic and Atmospheric Administration | ||||||||
Average temperature (°F)
7-day mean ending May 20, 2021

Source: National Oceanic and Atmospheric Administration
Deviation between average and normal (°F)
7-day mean ending May 20, 2021
Source: National Oceanic and Atmospheric Administration
