In the News:
Ethane affects gas quality on the Northern Border pipeline
In the most recent data reported by the Northern Border Pipeline Company (NBPL), ethane accounted for more than 14% of the volume of natural gas moved on the pipeline, causing the heat content on the pipeline (measured as British thermal units per cubic foot (Btu/cf)) to rise above 1,100 Btu/cf, the upper limit on most U.S. natural gas pipelines. This rise in heat content is occurring more often as more natural gas on NBPL comes from the Bakken play in North Dakota, where natural gas is ethane rich, and less from Canada, where historically most natural gas on NBPL was sourced. Not only can higher natural gas heat content cause operational issues for natural gas customers, but it makes delivering natural gas to interconnecting pipelines more challenging because most pipelines have heat content limitations. NBPL continues to investigate options to implement a 1,100 Btu/cf upper limit on natural gas heat content to address these issues. Their previous filings for a natural gas-quality tariff with the Federal Energy Regulatory Commission (FERC) in May and August of last year were rejected, although FERC encouraged NBPL to continue working with its shippers and other stakeholders to develop a proposal to address the operational concerns raised in their original filings.
NBPL, which runs from the Canadian border at Port of Morgan, Montana, to the Chicago market area, historically provided a path for natural gas produced in Alberta, Canada, to reach midwestern markets. Over the past seven years, as associated natural gas production in the Bakken area of North Dakota has increased with growing crude oil production, volumes of natural gas originating in North Dakota began to displace natural gas from Canada on the pipeline. As a result, the share of natural gas originating from Canada declined from about 75% in early 2014 to less than 25% in April 2021.
Throughout most of the 2010s, natural gas entering NBPL from Canada was very lean and the heat content was frequently close to 1,010 Btu/cf, the heat value of pure methane. Although the ethane content of natural gas from Alberta has gradually increased in recent years (which boosts its heat content), the monthly average value of natural gas from Alberta remains close to 1,050 Btu/cf. Natural gas produced in North Dakota, on the other hand, is liquids rich and, even after processing, has a Btu/cf value that frequently exceeds 1,100 Btu/cf. At some locations, the heat content exceeds 1,200 Btu/cf on a regular basis. The high heat content results in a blended value of natural gas on NBPL, even after natural gas produced in the Bakken is blended with lean imports from Canada, and it frequently exceeds 1,100 Btu/cf at Glen Ullin, North Dakota—a measurement point just past all major natural gas plant receipt points in the Bakken.
Since 2014, natural gas processing capacity in North Dakota has more than doubled, from less than 1.5 billion cubic feet per day (Bcf/d) to almost 4.0 Bcf/d, as of April 2021, which allows higher levels of ethane recovery. Natural gas quality data reported by NBPL show that up to 15% of the 2.5 billion cubic feet (Bcf/d) of natural gas moved past Glen Ullin is ethane, which translates to over 200,000 b/d of ethane in liquid form. However, the region has minimal demand for ethane, which is used as a feedstock for petrochemical manufacturing. Pipeline capacity to ship ethane and other natural gas plant liquids (NGPL) to demand centers along the U.S. Gulf Coast was recently expanded to 400,000 b/d. Only 60% of this capacity is utilized, however, because transportation and ethane prices currently make it more economic for most producers to leave the ethane in the natural gas stream (a process known as ethane rejection) to be sold for its heat value, rather than as a liquid.
Overview:
(For the week ending Wednesday, May 12, 2021)
- Natural gas spot price movements were mixed this report week (Wednesday, May 5 to Wednesday, May 12). The Henry Hub spot price fell from $2.97 per million British thermal units (MMBtu) last Wednesday to $2.90/MMBtu yesterday.
- At the NYMEX, the price of the June 2021 contract increased 3¢, from $2.938/MMBtu last Wednesday to $2.969/MMBtu yesterday. The price of the 12-month strip averaging June 2021 through May 2022 futures contracts climbed 2¢/MMBtu to $3.001/MMBtu.
- The net injections to working gas totaled 71 billion cubic feet (Bcf) for the week ending May 7. Working natural gas stocks totaled 2,029 Bcf, which is 16% lower than the year-ago level and 3% lower than the five-year (2016–2020) average for this week.
- The natural gas plant liquids composite price at Mont Belvieu, Texas, fell by 16¢/MMBtu, averaging $7.50/MMBtu for the week ending May 12 as a result of a 7% decline in propane prices that pulled the average index price down week over week. According to the most recent Weekly Petroleum Status Report data, there was a relatively rapid decline in domestic propane consumption, and a return to strong storage builds after 6 weeks of relatively flat inventories. The price of ethane rose 1%, as a result of strong demand for ethane feedstock in the petrochemical industry, as prices of ethylene, the basic chemical produced from cracking ethane, remained at close to double last year’s average level. Normal butane and isobutane rose by 1% and 2%, respectively, in response to increased blending of butane into gasoline due to EPA’s waiver of gasoline RVP limits related to the Colonial Pipeline shutdown. The price of natural gasoline remained flat week over week, in line with crude oil prices, which also remained flat week over week.
- According to Baker Hughes, for the week ending Tuesday, May 4, the natural gas rig count increased by 7 to 103. These increases were led by the Haynesville, which gained 4 rigs week over week, reaching the highest level since the first week of January 2020. The number of oil-directed rigs rose by 2 to 344; a 5-rig increase in the Permian was somewhat offset by declines in other basins. The total rig count increased by 8, and it now stands at 448, the highest level since the last week of April 2020.
Prices/Supply/Demand:
Natural gas prices are mixed as pipeline constraints ease and demand rises. This report week (Wednesday, May 5 to Wednesday, May 12), the Henry Hub spot price fell 7¢ from $2.97/MMBtu last Wednesday to $2.90/MMBtu yesterday. Henry Hub prices were relatively flat, hovering around $2.90/MMBtu since last Thursday and dipping to a weekly low of $2.88/MMBtu on Tuesday.
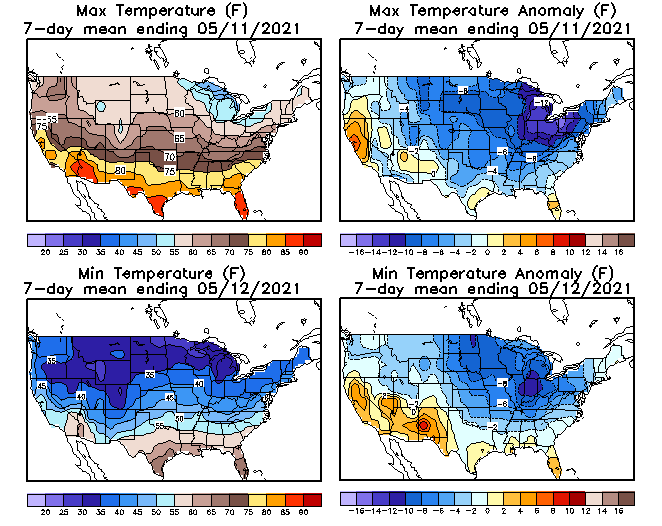
Midwest prices rise as cooler temperatures return to the region. At the Chicago Citygate, the price increased 3¢ from $2.77/MMBtu last Wednesday to a weekly high of $2.80/MMBtu yesterday. The Natural Gas Intelligence Midwest Regional Average price also rose by 3¢ from $2.72/MMBtu last Wednesday to $2.76/MMBtu yesterday. Temperatures in Chicago averaged 46ºF on Tuesday and 50ºF yesterday, 13ºF and 9ºF below normal, respectively.
Price movements in California are mixed as SoCalGas begins maintenance on Aliso Canyon, its largest natural gas storage facility. The price at PG&E Citygate in Northern California rose 16¢, up from $3.91/MMBtu last Wednesday to a weekly high of $4.07/MMBtu yesterday. Prices at Malin, Oregon, the northern delivery point into PG&E service territory, rose 6¢ week over week from $2.82/MMBtu last Wednesday to $2.88/MMBtu yesterday. At the southern delivery point to PG&E the Natural Gas Intelligence Southern Border PG&E composite price rose by 9¢ from $2.76/MMBtu last week to $2.85/MMBtu yesterday. The El Paso Natural Gas Company reports constraints on its Line 3000, which connects the Topock hub on the California/Arizona border with PG&E’s southern delivery point.
The price at SoCal Citygate in Southern California decreased 43¢ from $3.82/MMBtu last Wednesday to $3.39/MMBtu yesterday. Prices fell as low as $3.72/MMBtu on Friday in advance of maintenance at the Aliso Canyon storage facility, which would have provided an outlet for excess natural gas volumes to balance the market if it were not under maintenance. SoCalGas reports maintenance at Aliso Canyon, its largest natural gas storage facility, has reduced access to storage during the injection season by 545 million cubic feet per day (MMcf/d). The outage began on May 9 and will last through May 24.
Northeast prices decline as temperatures return to normal levels. An early end to maintenance on Transco pipeline’s Leidy lateral (see below) increased flows of natural gas out of the Appalachia Basin production region to delivery points south of New York City, improving natural gas availability into the northeast. At the Algonquin Citygate, which serves Boston-area consumers, the price went down 60¢ from $2.89/MMBtu last Wednesday to $2.29/MMBtu yesterday. Temperatures in Boston averaged 60ºF on Tuesday and 59ºF yesterday, 3ºF and 2ºF above normal, respectively. At the Transcontinental Pipeline Zone 6 trading point for New York City, the price decreased 19¢ from $2.44/MMBtu last Wednesday to $2.25/MMBtu yesterday.
Prices in the Appalachian Basin production region are mixed as pipeline maintenance ends, easing takeaway constraints. In northeast Pennsylvania, the Tennessee Zone 4 Marcellus spot price increased 20¢ from $1.50/MMBtu last Wednesday to $1.70/MMBtu yesterday. Williams reports that maintenance on its Leidy Line, which is an outlet for northeast Pennsylvania production, is moving ahead of schedule and will be back in service today, alleviating takeaway constraints in the region and allowing prices to rise. The price at Dominion South in southwest Pennsylvania, which served as an alternative path out of the region during maintenance on the Leidy Line, fell 14¢ from $2.33/MMBtu last Wednesday to $2.19/MMBtu yesterday.
Prices in the Permian production region in West Texas rose week over week in response to falling production. The price at the Waha Hub in West Texas, which is located near Permian Basin production activities, rose 3¢ from $2.69/MMBtu last Wednesday to $2.72/MMBtu yesterday. IHS Markit reports West Texas production declined by more than 0.8 billion cubic feet per day (Bcf/d) week over week, reducing volumes on constrained takeaway pipelines. The Waha discount to Henry Hub has declined, as a result, from 28¢/MMBtu last week to 18¢/MMBtu this week.
U.S. production increases slightly. According to data from IHS Markit, the average total supply of natural gas rose by 0.5% compared with the previous report week. Dry natural gas production grew slightly by 0.2% compared with the previous report week to average 91.8 Bcf/d, or 3.6% higher than this time last year. Average net imports from Canada increased by 6.6% from last week.
Heating demand in the residential and commercial sectors drives U.S. demand increase. Total U.S. consumption of natural gas rose by 6.3% compared with the previous report week, according to data from IHS Markit. Natural gas consumed for power generation declined by 5.6% week over week as mild temperatures in the south decreased cooling demand. Industrial sector consumption increased by 2.3% week over week. In the residential and commercial sectors, consumption increased by 39.5% because of increased heating demand in the Midwest and Northeast amid cooler-than-normal temperatures. Natural gas exports to Mexico increased 4.7% to 6.2 Bcf/d. Natural gas deliveries to U.S. liquefied natural gas (LNG) export facilities (LNG pipeline receipts) averaged 11.2 Bcf/d, about the same level as last week.
U.S. LNG exports decrease week over week. Twenty-one LNG vessels (seven from Sabine Pass, four each from Corpus Christi and Freeport, three from Cameron, two from Cove Point, and one from Elba Island) with a combined LNG-carrying capacity of 74 Bcf departed the United States between May 6 and May 12, 2021, according to shipping data provided by Bloomberg Finance, L.P.
Storage:
The net injections into storage totaled 71 Bcf for the week ending May 7, compared with the five-year (2016–2020) average net injections of 82 Bcf and last year's net injections of 104 Bcf during the same week. Working natural gas stocks totaled 2,029 Bcf, which is 72 Bcf lower than the five-year average and 378 Bcf lower than last year at this time.
According to The Desk survey of natural gas analysts, estimates of the weekly net change to working natural gas stocks ranged from net injections of 65 Bcf to 82 Bcf, with a median estimate of 76 Bcf.
More storage data and analysis can be found on the Natural Gas Storage Dashboard and the Weekly Natural Gas Storage Report.
See also:
 Source: Northern Border Pipeline Company; Genscape
 Note: Receipts from Canada = metered volumes at Port of Morgan, Montana Net Bakken receipts = metered volumes at Glen Ullin, North Dakota less receipts from Canada.


| Spot Prices ($/MMBtu) | Thu, 06-May |
Fri, 07-May |
Mon, 10-May |
Tue, 11-May |
Wed, 12-May |
|---|---|---|---|---|---|
| Henry Hub |
2.90 |
2.90 |
2.90 |
2.88 |
2.90 |
| New York |
2.43 |
2.40 |
2.46 |
2.45 |
2.25 |
| Chicago |
2.76 |
2.76 |
2.79 |
2.79 |
2.80 |
| Cal. Comp. Avg.* |
3.21 |
3.08 |
3.22 |
3.27 |
3.30 |
| Futures ($/MMBtu) | |||||
| June contract | 2.928 |
2.958 |
2.932 |
2.955 |
2.969 |
| July contract |
2.974 |
3.004 |
2.978 |
2.999 |
3.018 |
| *Avg. of NGI's reported prices for: Malin, PG&E Citygate, and Southern California Border Avg. | |||||
| Source: NGI's Daily Gas Price Index | |||||


| U.S. natural gas supply - Gas Week: (5/6/21 - 5/12/21) | |||
|---|---|---|---|
Average daily values (Bcf/d): |
|||
this week |
last week |
last year |
|
| Marketed production | 103.9 |
103.8 |
99.0 |
| Dry production | 91.8 |
91.6 |
88.6 |
| Net Canada imports | 4.8 |
4.5 |
3.8 |
| LNG pipeline deliveries | 0.1 |
0.1 |
0.1 |
| Total supply | 96.7 |
96.1 |
92.5 |
|
Source: IHS Markit | |||
| U.S. natural gas consumption - Gas Week: (5/6/21 - 5/12/21) | |||
|---|---|---|---|
Average daily values (Bcf/d): |
|||
this week |
last week |
last year |
|
| U.S. consumption | 65.4 |
61.5 |
64.9 |
| Power | 26.0 |
27.5 |
24.3 |
| Industrial | 22.1 |
21.5 |
20.8 |
| Residential/commercial | 17.4 |
12.4 |
19.8 |
| Mexico exports | 6.2 |
5.9 |
4.8 |
| Pipeline fuel use/losses | 6.2 |
6.2 |
6.1 |
| LNG pipeline receipts | 11.2 |
11.2 |
7.4 |
| Total demand | 89.1 |
84.8 |
83.3 |
|
Source: IHS Markit | |||


| Rigs | |||
|---|---|---|---|
Tue, May 04, 2021 |
Change from |
||
last week |
last year |
||
| Oil rigs | 344 |
0.6% |
17.8% |
| Natural gas rigs | 103 |
7.3% |
28.8% |
| Note: Excludes any miscellaneous rigs | |||
| Rig numbers by type | |||
|---|---|---|---|
Tue, May 04, 2021 |
Change from |
||
last week |
last year |
||
| Vertical | 17 |
-10.5% |
88.9% |
| Horizontal | 408 |
2.5% |
20.7% |
| Directional | 23 |
0.0% |
-14.8% |
| Source: Baker Hughes Co. | |||
| Working gas in underground storage | ||||
|---|---|---|---|---|
Stocks billion cubic feet (Bcf) |
||||
| Region | 2021-05-07 |
2021-04-30 |
change |
|
| East | 347 |
332 |
15 |
|
| Midwest | 458 |
442 |
16 |
|
| Mountain | 131 |
124 |
7 |
|
| Pacific | 235 |
224 |
11 |
|
| South Central | 857 C |
836 |
21 |
|
| Total | 2,029 C |
1,958 |
71 |
|
|
Source: Form EIA-912, Weekly Underground Natural Gas Storage Report C = Reclassification Reclassifications from working gas to base gas resulted in decreased working gas stocks of 4 Bcf in the South Central nonsalt region for the week ending May 7, 2021. The implied flow for the week is an increase of 75 Bcf to working gas stocks. (See Notes and Definitions for more information on "implied flow.") | ||||
| Working gas in underground storage | |||||
|---|---|---|---|---|---|
Historical comparisons |
|||||
Year ago (5/7/20) |
5-year average (2016-2020) |
||||
| Region | Stocks (Bcf) |
% change |
Stocks (Bcf) |
% change |
|
| East | 448 |
-22.5 |
369 |
-6.0 |
|
| Midwest | 551 |
-16.9 |
448 |
2.2 |
|
| Mountain | 116 |
12.9 |
122 |
7.4 |
|
| Pacific | 238 |
-1.3 |
227 |
3.5 |
|
| South Central | 1,054 |
-18.7 |
934 |
-8.2 |
|
| Total | 2,407 |
-15.7 |
2,101 |
-3.4 |
|
| Source: Form EIA-912, Weekly Underground Natural Gas Storage Report | |||||
| Temperature – heating & cooling degree days (week ending May 06) | ||||||||
|---|---|---|---|---|---|---|---|---|
HDD deviation from: |
CDD deviation from: |
|||||||
| Region | HDD Current |
normal |
last year |
CDD Current |
normal |
last year |
||
| New England | 75 |
-15 |
-2 |
0 |
0 |
0 |
||
| Middle Atlantic | 53 |
-21 |
-12 |
1 |
0 |
1 |
||
| E N Central | 68 |
-11 |
-13 |
1 |
-2 |
1 |
||
| W N Central | 61 |
-8 |
1 |
6 |
0 |
3 |
||
| South Atlantic | 17 |
-15 |
-13 |
50 |
24 |
23 |
||
| E S Central | 23 |
-6 |
-2 |
27 |
11 |
7 |
||
| W S Central | 10 |
0 |
4 |
44 |
6 |
-15 |
||
| Mountain | 58 |
-23 |
13 |
19 |
6 |
-7 |
||
| Pacific | 17 |
-32 |
-2 |
6 |
0 |
2 |
||
| United States | 43 |
-16 |
-5 |
19 |
6 |
3 |
||
|
Note: HDD = heating degree day; CDD = cooling degree day Source: National Oceanic and Atmospheric Administration | ||||||||
Average temperature (°F)
7-day mean ending May 06, 2021

Source: National Oceanic and Atmospheric Administration
Deviation between average and normal (°F)
7-day mean ending May 06, 2021
Source: National Oceanic and Atmospheric Administration
