In the News:
SoCalGas begins December with similar natural gas stock levels but more flexibility compared with last winter
On December 1, Southern California Gas Company’s (SoCalGas) working natural gas inventory totaled 74.8 billion cubic feet (Bcf), slightly lower than the year-ago stock level, but 8.6% higher than it was in 2017. Demand for natural gas in Southern California often begins peaking in December, when average temperatures in the region are typically at their lowest.
Despite a similar stock level as last winter, SoCalGas now has additional supply flexibility. In July 2019, the California Public Utilities Commission approved new rules granting SoCalGas more flexibility this winter to withdraw natural gas from its Aliso Canyon storage facility. Following the October 2015–February 2016 leak, SoCalGas was only permitted to withdraw from Aliso Canyon as a last resort. Aliso Canyon, with current authorized working gas storage totaling 34 Bcf, is the largest storage facility available to SoCalGas.
In addition, in October 2019, repairs to Line 235-2, located in southeastern California, were completed, which increased pipeline capacity by 270 million cubic feet per day and allowed access to lower cost natural gas from the San Juan and Permian Basins through the Needles and Topock receipt points. Line 235-2 had faced reduced capacity after an October 2017 rupture on the pipeline.
The National Oceanic and Atmospheric Administration’s winter outlook forecasts the 2019–2020 winter to be warmer and drier in Southern California than normal, which may limit natural gas demand in the region. Last year, the average winter (November 2018–March 2019) natural gas spot price at the SoCalGas Citygate reached a record $6.93 per Million British thermal units (MMBtu). Daily price spikes as high as $22.29/MMBtu occurred in February 2019 because of colder-than-normal weather and supply constraints.
However, this winter, market expectations―as evidenced by forward markets―indicate lower natural gas prices than last winter’s record prices. These forward prices are a combination of the Henry Hub futures contract and the basis futures contract (the regional component of the overall price).The SoCalGas Citygate December 2019 forward contract closed at $6.66/MMBtu with the January–March 2020 contracts trading at an average of $4.01/MMBtu as of December 2.
The spot price at SoCalGas Citygate closed at $5.80/MMBtu on November 27, the last trading day in November, as the region experienced colder-than-normal temperatures late in the month that put upward pressure on prices. Prices were also high as a result of maintenance at SoCalGas storage facilities. Withdrawal restrictions from November 15 through November 27 on the Honor Rancho storage facility, which comprises about 32% of SoCalGas’s storage capacity, contributed to the high late November prices. During the maintenance, SoCalGas withdrew natural gas from the Aliso Canyon facility under the new withdrawal protocol.
Overview:
(For the week ending Wednesday, December 4, 2019)
- Natural gas spot prices fell at most locations this report week (Wednesday, November 27 to Wednesday, December 4). The Henry Hub spot price rose from $2.33 per million British thermal units (MMBtu) last Wednesday to $2.37/MMBtu yesterday.
- At the New York Mercantile Exchange (Nymex), the December 2019 contract expired November 26 at $2.470/MMBtu. The price of the January 2020 contract decreased 10¢, from $2.501/MMBtu last Wednesday to $2.399/MMBtu yesterday. The price of the 12-month strip averaging January 2020 through December 2020 futures contracts declined 7¢/MMBtu to $2.333/MMBtu.
- The net withdrawal from working gas totaled 19 billion cubic feet (Bcf) for the week ending November 29. Working natural gas stocks total 3,591 Bcf, which is 20% more than the year-ago level and the same as the five-year (2014–18) average for this week.
- The natural gas plant liquids composite price at Mont Belvieu, Texas, fell by 27¢/MMBtu, averaging $5.77/MMBtu for the week ending December 4. The prices of ethane, butane, isobutane, natural gasoline, and propane, all fell, by 8%, 7%, 5%, 4%, and 2%, respectively.
- According to Baker Hughes, for the week ending Tuesday, November 26, the natural gas rig count decreased by 2 to 131. The number of oil-directed rigs fell by 3 to 688. The total rig count decreased by 5, and it now stands at 802.
Prices/Supply/Demand:
Prices trade in narrow ranges with unseasonably warm temperatures. This report week (Wednesday, November 27 to Wednesday, December 4), the Henry Hub spot price traded within a narrow range and rose 4¢ from $2.33/MMBtu last Wednesday to $2.37/MMBtu yesterday. Temperatures were generally warmer than normal across most of the Lower 48 states. At the Chicago Citygate, the price decreased 6¢ from $2.25/MMBtu last Wednesday to $2.19/MMBtu yesterday.
Prices in the Pacific Northwest fall as Enbridge pipeline is cleared to return to full operating pressure. The price at Sumas on the Canada-Washington border fell $2.11 from a high of $4.93/MMBtu last Wednesday to $2.82/MMBtu yesterday. On November 28, the Canada Energy Regulator approved the Enbridge Westcoast 36-inch line to return to full operating pressure, following an October 2018 explosion.
California prices fall following high demand over the holiday weekend. The price at PG&E Citygate in Northern California fell 35¢ from a high of $3.63/MMBtu last Wednesday to $3.28/MMBtu yesterday. The price at SoCal Citygate in Southern California decreased 68¢ from a high of $5.80/MMBtu last Wednesday to a low of $5.12/MMBtu yesterday. Southern California withdrew an estimated 3.4 Bcf from Aliso Canyon during the report week, or 4% of its reserves, to meet demand. The volumes withdrawn, which placed upward pressure on prices, eased throughout the week. The In the News section of this report provides additional analysis on Southern California.
Northeast prices decline. At the Algonquin Citygate, which serves Boston-area consumers, the price went down 85¢ from $4.63/MMBtu last Wednesday to a low of $3.78/MMBtu yesterday. At the Transcontinental Pipeline Zone 6 trading point for New York City, the price decreased 4¢ from $2.40/MMBtu last Wednesday to a low of $2.36/MMBtu yesterday.
The Tennessee Zone 4 Marcellus spot price was constant week over week at $1.79/MMBtu. The price at Dominion South in southwest Pennsylvania fell 5¢ from $1.85/MMBtu last Wednesday to $1.80/MMBtu yesterday.
Permian Basin prices strengthen throughout the week, narrowing the discount to the Henry Hub. The price at the Waha Hub in West Texas, which is located near Permian Basin production activities, averaged $0.97/MMBtu last Wednesday, $1.36/MMBtu lower than the Henry Hub price. Yesterday, the price at the Waha Hub averaged a high of $1.49/MMBtu, 88¢/MMBtu lower than the Henry Hub price.
Supply rises with increased imports from Canada. According to data from IHS Markit, the average total supply of natural gas rose by 1% compared with the previous report week. Dry natural gas production remained constant week over week. Average net imports from Canada increased by 20% from last week.
Demand rises across all sectors. Total U.S. consumption of natural gas rose by 7% compared with the previous report week, according to data from IHS Markit. Natural gas consumed for power generation climbed by 6% week over week. In the residential and commercial sectors, consumption increased by 13%. Industrial sector consumption stayed constant, averaging 24.4 Bcf/d. Natural gas exports to Mexico increased 2%.
U.S. LNG exports decrease week over week. Ten liquefied natural gas (LNG) vessels (five from Sabine Pass; two from Corpus Christi; and one each from Cove Point, Cameron, and Freeport) with a combined LNG-carrying capacity of 36 Bcf departed the United States between November 28 and December 4, according to shipping data compiled by Bloomberg. Four vessels (one each at Sabine Pass, Corpus Christi, Cameron, and Freeport) were loading on Wednesday.
Storage:
The net withdrawal from storage totaled 19 Bcf for the week ending November 29, compared with the five-year (2014–18) average net withdrawal of 41 Bcf and last year's net withdrawal of 62 Bcf during the same week. Working natural gas stocks totaled 3,591 Bcf, which is 9 Bcf lower than the five-year average and 591 Bcf more than last year at this time.
According to The Desk survey of natural gas analysts, estimates of the weekly net change to working natural gas stocks ranged from a net withdrawal of 5 Bcf to 37 Bcf, with a median estimate of 18 Bcf.
More storage data and analysis can be found on the Natural Gas Storage Dashboard and the Weekly Natural Gas Storage Report.
See also:


| Spot Prices ($/MMBtu) | Thu, 21-Nov |
Fri, 22-Nov |
Mon, 25-Nov |
Tue, 26-Nov |
Wed, 27-Nov |
|---|---|---|---|---|---|
| Henry Hub | 2.48 | 2.56 | 2.44 | 2.35 | 2.33 |
| New York | 2.52 | 2.56 | 2.32 | 2.24 | 2.40 |
| Chicago | 2.41 | 2.48 | 2.33 | 2.25 | 2.25 |
| Cal. Comp. Avg,* | 4.56 | 4.73 | 4.41 | 4.27 | 4.31 |
| Futures ($/MMBtu) | |||||
| December Contract | 2.567 | 2.665 | 2.531 | 2.470 | Expired |
| January Contract | 2.662 | 2.710 | 2.584 | 2.553 | 2.501 |
| February Contract | 2.569 | 2.655 | 2.541 | 2.501 | 2.470 |
| *Avg. of NGI's reported prices for: Malin, PG&E Citygate, and Southern California Border Avg. | |||||
| Source: NGI's Daily Gas Price Index | |||||
| Spot Prices ($/MMBtu) | Thu, 28-Nov |
Fri, 29-Nov |
Mon, 2-Dec |
Tue, 3-Dec |
Wed, 4-Dec |
|---|---|---|---|---|---|
| Henry Hub | Holiday | Closed | 2.25 | 2.40 | 2.37 |
| New York | Holiday | Closed | 2.41 | 2.49 | 2.36 |
| Chicago | Holiday | Closed | 2.13 | 2.24 | 2.19 |
| Cal. Comp. Avg,* | Holiday | Closed | 3.77 | 3.78 | 3.71 |
| Futures ($/MMBtu) | |||||
| January Contract | Holiday | Closed | 2.329 | 2.441 | 2.339 |
| February Contract | Holiday | Closed | 2.308 | 2.405 | 2.374 |
| *Avg. of NGI's reported prices for: Malin, PG&E Citygate, and Southern California Border Avg. | |||||
| Source: NGI's Daily Gas Price Index | |||||


| U.S. natural gas supply - Gas Week: (11/28/19 - 12/4/19) | |||
|---|---|---|---|
Average daily values (Bcf/d): |
|||
this week |
last week |
last year |
|
| Marketed production | 109.8 |
110.0 |
101.0 |
| Dry production | 96.7 |
96.8 |
89.8 |
| Net Canada imports | 3.7 |
3.1 |
3.8 |
| LNG pipeline deliveries | 0.1 |
0.1 |
0.1 |
| Total supply | 100.6 |
100.0 |
93.7 |
|
Source: IHS Markit | |||
| U.S. natural gas consumption - Gas Week: (11/28/19 - 12/4/19) | |||
|---|---|---|---|
Average daily values (Bcf/d): |
|||
this week |
last week |
last year |
|
| U.S. consumption | 89.6 |
83.5 |
86.3 |
| Power | 26.6 |
25.1 |
24.7 |
| Industrial | 24.4 |
24.3 |
24.9 |
| Residential/commercial | 38.6 |
34.1 |
36.7 |
| Mexico exports | 5.2 |
5.1 |
4.6 |
| Pipeline fuel use/losses | 7.3 |
7.1 |
6.8 |
| LNG pipeline receipts | 7.5 |
7.2 |
4.4 |
| Total demand | 109.5 |
102.9 |
102.2 |
|
Source: IHS Markit | |||


| Rigs | |||
|---|---|---|---|
Tue, November 26, 2019 |
Change from |
||
last week |
last year |
||
| Oil rigs | 668 |
-0.4% |
-24.7% |
| Natural gas rigs | 131 |
1.6% |
-30.7% |
| Note: Excludes any miscellaneous rigs | |||
| Rig numbers by type | |||
|---|---|---|---|
Tue, November 26, 2019 |
Change from |
||
last week |
last year |
||
| Vertical | 0 |
0.0% |
0.0% |
| Horizontal | 14 |
0.0% |
-48.1% |
| Directional | 53 |
-1.9% |
-22.1% |
| Source: Baker Hughes Inc. | |||
| Working gas in underground storage | ||||
|---|---|---|---|---|
Stocks billion cubic feet (Bcf) |
||||
| Region | 2019-11-29 |
2019-11-22 |
change |
|
| East | 891 |
894 |
-3 |
|
| Midwest | 1,040 |
1,052 |
-12 |
|
| Mountain | 200 |
204 |
-4 |
|
| Pacific | 286 |
293 |
-7 |
|
| South Central | 1,174 |
1,166 |
8 |
|
| Total | 3,591 |
3,610 |
-19 |
|
|
Source: Form EIA-912, Weekly Underground Natural Gas Storage Report | ||||
| Working gas in underground storage | |||||
|---|---|---|---|---|---|
Historical comparisons |
|||||
Year ago (11/29/18) |
5-year average (2014-2018) |
||||
| Region | Stocks (Bcf) |
% change |
Stocks (Bcf) |
% change |
|
| East | 756 |
17.9 |
857 |
4.0 |
|
| Midwest | 917 |
13.4 |
1,035 |
0.5 |
|
| Mountain | 168 |
19.0 |
206 |
-2.9 |
|
| Pacific | 253 |
13.0 |
320 |
-10.6 |
|
| South Central | 906 |
29.6 |
1,183 |
-0.8 |
|
| Total | 3,000 |
19.7 |
3,600 |
-0.3 |
|
| Source: Form EIA-912, Weekly Underground Natural Gas Storage Report | |||||
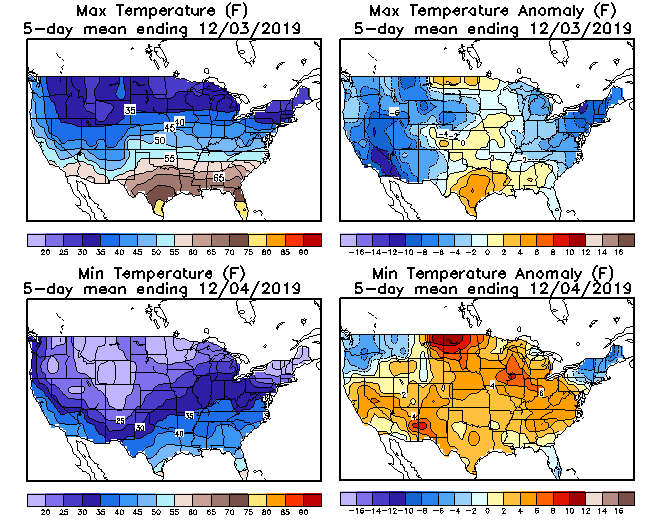
| Temperature – heating & cooling degree days (week ending Nov 28) | ||||||||
|---|---|---|---|---|---|---|---|---|
HDD deviation from: |
CDD deviation from: |
|||||||
| Region | HDD Current |
normal |
last year |
CDD Current |
normal |
last year |
||
| New England | 167 |
-19 |
-65 |
0 |
0 |
0 |
||
| Middle Atlantic | 158 |
-19 |
-63 |
0 |
0 |
0 |
||
| E N Central | 181 |
-22 |
-38 |
0 |
0 |
0 |
||
| W N Central | 207 |
-22 |
-27 |
0 |
0 |
0 |
||
| South Atlantic | 107 |
-14 |
-51 |
8 |
-2 |
0 |
||
| E S Central | 103 |
-22 |
-53 |
0 |
-1 |
0 |
||
| W S Central | 71 |
-19 |
-20 |
6 |
2 |
3 |
||
| Mountain | 207 |
10 |
32 |
0 |
0 |
0 |
||
| Pacific | 115 |
14 |
37 |
0 |
-1 |
0 |
||
| United States | 148 |
-12 |
-24 |
2 |
0 |
0 |
||
|
Note: HDD = heating degree day; CDD = cooling degree day Source: National Oceanic and Atmospheric Administration | ||||||||
Average temperature (°F)
7-day mean ending Nov 28, 2019

Source: National Oceanic and Atmospheric Administration
Deviation between average and normal (°F)
7-day mean ending Nov 28, 2019
Source: National Oceanic and Atmospheric Administration
