In the News:
Futures prices signal cheaper mid-winter natural gas in most regions in 2020
The current outlook for natural gas prices at key hubs reflects market expectations for lower prices in mid-winter (January and February), except in New England. Two factors account for generally lower prices: lower natural gas futures prices at the Henry Hub and lower regional differentials to the Henry Hub (the basis). The Henry Hub price is lower because of higher-than-average natural gas storage inventories and strong production. Regional prices at many key trading hubs have lower premiums to the Henry Hub price because natural gas pipeline constraints have eased.
Average, forward natural gas prices for January and February 2020 at key regional natural gas trading hubs—Algonquin Citygate, Henry Hub, Chicago Citygate, Southern California Gas Citygate (SoCal Citygate), and Sumas—currently reflect lower overall prices compared with this time a year ago. Except at Henry Hub, these forward prices are a combination of the Henry Hub futures contract and the basis futures contract (the regional component of the overall price).
Algonquin Citygate – The Algonquin Citygate price is a good proxy for the wholesale price of natural gas delivered to New England. The Algonquin price is typically at a premium to the Henry Hub price throughout mid-winter because of constraints on key natural gas pipelines. The premium to Henry Hub this mid-winter is expected to average $6.07 per million British thermal units (MMBtu). The average January and February 2020 natural gas futures prices in New England is 11¢ higher than last year despite the lower Henry Hub futures price for those months. This higher price differential is the result of expectations for high utilization on natural gas pipelines such as Algonquin Gas Transmission and Tennessee Gas Pipeline. Average spot prices month-to-date in October averaged $1.75/MMBtu, 47¢ lower than Henry Hub.
SoCal Citygate – Forward markets indicate a narrowing basis price for Southern California. The average SoCal mid-winter price this year is $1.33/MMBtu higher than the Henry Hub price compared with last year’s mid-winter price difference of $3.32/MMBtu higher than Henry Hub.
Key factors contributing to lower SoCal Citygate mid-winter prices include;
- Increased overall pipeline capacity associated with repairs to Southern California Gas Company’s (SoCalGas) Line 235-2
- The return of 270 million cubic feet per day of capacity at Topock and Needles (supporting access to lower cost natural gas supplies in the San Juan and Permian Basins)
- The California Public Utilities Commission granting SoCalGas more flexibility this winter to withdraw from the Aliso Canyon natural gas storage facility
During the past few winters, Aliso Canyon was only available for withdrawals as a last resort. Average spot prices month-to-date in October averaged $3.56/MMBtu, $1.34 higher than Henry Hub.
Sumas – The basis price has narrowed as the region recovers from an October 2018 pipeline explosion in British Columbia, which elevated natural gas prices in the Pacific Northwest. The average mid-winter basis price this year at Sumas is $0.73/MMBtu higher than the Henry Hub price compared with last year’s mid-winter price difference of $1.93/MMBtu. According to Genscape, average October flows through Sumas in 2019 have increased 22% compared with average flows last October, but they are still down 27% compared with average flows in October 2017. However, Natural Gas Intelligence reports that Westcoast Transmission updated its maintenance calendar, which shows that flows through Sumas are set to return to near normal capacity in November. Average spot prices month-to-date in October averaged $3.41/MMBtu, $1.19/MMBtu higher than the Henry Hub price.
Chicago Citygate – According to forward markets, the narrow basis price that occurred in mid-winter 2019 should further shrink in mid-winter 2020. In mid-winter 2019, the basis was $0.68/MMBtu The mid-winter 2020 basis has shrunk to just $0.38/MMBtu as higher volumes of low-cost natural gas from the Appalachia Basin are expected to continue flowing into the Midwest. Average spot prices month-to-date in October averaged $1.97/MMBtu, 25¢/MMBtu lower than the Henry Hub price.
Overview:
(For the week ending Wednesday, October 30, 2019)
- Natural gas spot prices rose at most locations this report week (Wednesday, October 23 to Wednesday, October 30). Henry Hub spot prices rose from $2.28 per million British thermal units (MMBtu) last Wednesday to $2.67/MMBtu yesterday.
- At the New York Mercantile Exchange (Nymex), the November 2019 contract expired Tuesday at $2.597/MMBtu, up 32¢/MMBtu from last Wednesday. The December 2019 contract increased to $2.691/MMBtu, up 26¢/MMBtu from last Wednesday to yesterday. The price of the 12-month strip averaging December 2019 through November 2020 futures contracts climbed 14¢/MMBtu to $2.498/MMBtu.
- Net injections to working gas totaled 89 billion cubic feet (Bcf) for the week ending October 25. Working natural gas stocks are 3,695 Bcf, which is 18% more than the year-ago level and 1% more than the five-year (2014–18) average for this week.
- The natural gas plant liquids composite price at Mont Belvieu, Texas, rose by 2¢/MMBtu, averaging $5.27/MMBtu for the week ending October 30. The price of isobutane and butane fell by 7% and 1%, respectively. The price of natural gasoline, ethane, and propane rose by 3%, 2%, and 1%, respectively.
- According to Baker Hughes, for the week ending Tuesday, October 22, the natural gas rig count decreased by 4 to 133. The number of oil-directed rigs fell by 17 to 696. The total rig count decreased by 21, and it now stands at 830.
Prices/Supply/Demand:
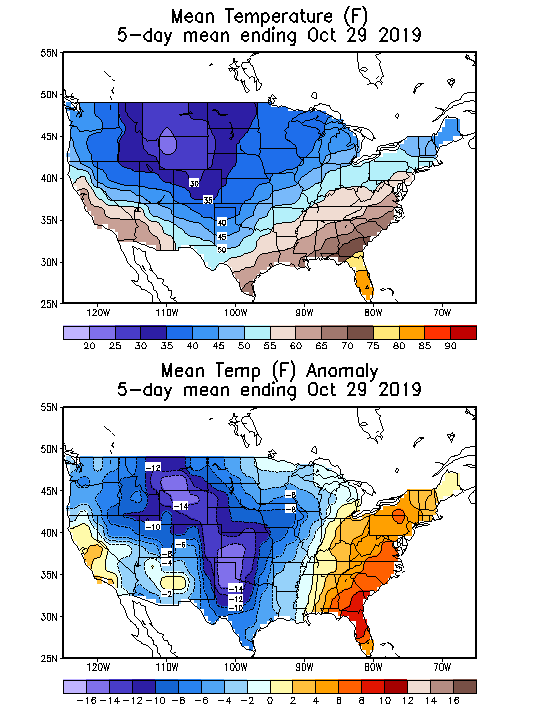
Prices rise at most locations with the onset of cold weather. This report week (Wednesday, October 23 to Wednesday, October 30), the Henry Hub spot price rose 39¢ from $2.28/MMBtu last Wednesday to a high of $2.67/MMBtu yesterday. Temperatures were cooler than normal across most of the country and warmer than normal on the eastern seaboard. At the Chicago Citygate, the price increased 40¢ from $2.29/MMBtu last Wednesday to a high of $2.69/MMBtu yesterday.
West coast prices are up as cold weather sets in the Rocky Mountains. The price at Opal Hub in southwest Wyoming rose 94¢ from $2.22/MMBtu last Wednesday to a high of $3.16/MMBtu yesterday. The price at Sumas on the Canada-Washington border rose $1.02 from $2.97/MMBtu last Wednesday to $3.99/MMBtu yesterday. Prices faced upward pressure as record-cold temperatures were felt across the Intermountain West and High Plains, increasing natural gas demand. The cold weather also led to production declines in the region, according to IHS Markit.
Because much of the natural gas delivered into California flows through the Opal and Sumas hubs, California natural gas spot prices also rose this report week. The price at Pacific Gas and Electric (PG&E) Citygate in Northern California rose 24¢, up from $3.16/MMBtu last Wednesday, to a high of $3.40/MMBtu yesterday. With fires and strong winds near San Francisco and Los Angeles, some utility companies have taken the safety measure of cutting service to natural gas and electricity customers. PG&E enacted a public safety power shutoff on October 26, affecting an estimated 930,000 customers in northern and central California. The price at SoCal Citygate in Southern California increased 33¢ from $3.40/MMBtu last Wednesday to a high of $3.73/MMBtu yesterday.
Northeast prices decline as demand markets experience above-normal temperatures. At the Algonquin Citygate, which serves Boston-area consumers, the price went down 6¢ from $1.96/MMBtu last Wednesday to $1.90/MMBtu yesterday. At the Transcontinental Pipeline Zone 6 trading point for New York City, the price decreased 8¢ from $1.95/MMBtu last Wednesday to $1.87/MMBtu yesterday. Both Boston and New York City experienced warmer-than-normal temperatures; daily minimum temperatures were 8‒10 degrees Fahrenheit (°F) higher than average during the report week.
The Tennessee Zone 4 Marcellus spot price increased 1¢ from $1.74/MMBtu last Wednesday to $1.75/MMBtu yesterday. The price at Dominion South in southwest Pennsylvania fell 6¢ from $1.85/MMBtu last Wednesday to $1.79/MMBtu yesterday.
Permian Basin prices rise throughout the week. The price at the Waha Hub in West Texas, which is located near Permian Basin production activities, averaged $0.08/MMBtu last Wednesday, $2.20/MMBtu lower than the Henry Hub price. Yesterday, the price at the Waha Hub averaged $1.88/MMBtu, the highest of the week and 79¢/MMBtu lower than Henry Hub.
Supply is flat. According to data from IHS Markit, the average total supply of natural gas remained the same as in the previous report week, averaging 99.1 Bcf/d. Dry natural gas production topped 95 Bcf/d―the highest on record―on October 27 and 28, but ultimately remained constant week over week. Average net imports from Canada increased by 5% from last week.
Demand rises across all sectors except power generation. Total U.S. consumption of natural gas rose by 2% compared with the previous report week, according to data from IHS Markit. Natural gas consumed for power generation declined by 1% week over week. Industrial sector consumption increased by 4% week over week. In the residential and commercial sectors, consumption increased by 6%. Natural gas exports to Mexico increased 1%.
U.S. LNG exports increase over week. Fourteen LNG vessels (eight from Sabine Pass; three from Corpus Christi; and one each from Cove Point, Cameron, and Freeport) with a combined LNG-carrying capacity of 51 Bcf departed the United States between October 24 and October 30, according to shipping data compiled by Bloomberg. One vessel was loading at the Sabine Pass terminal on Wednesday. One of the tankers loading at Sabine Pass was the Qatari-operated Q-flex tanker (LNG-carrying capacity 4.8 Bcf). Last report week was the second time a Very Large Qatari tanker loaded LNG in the United States since February 2016.
Cameron LNG LLC, the developer of Cameron LNG terminal in Louisiana, received a letter order from the Federal Energy Regulatory Commission to begin commissioning activities for Train 2. Cameron LNG is a three-train facility located in Louisiana with a combined capacity of 1.8 Bcf/d. Train 1 at Cameron LNG shipped its first cargo in May and began commercial operations in August 2019. Train 2 at Cameron LNG is expected to be placed in service in early 2020, followed by Train 3 in the second quarter of 2020.
Storage:
Net injections into storage totaled 89 Bcf for the week ending October 25, compared with the five-year (2014–18) average net injections of 65 Bcf and last year's net injections of 49 Bcf during the same week. Working gas stocks totaled 3,695 Bcf, which is 52 Bcf more than the five-year average and 559 Bcf more than last year at this time.
According to The Desk survey of natural gas analysts, estimates of the weekly net change from working natural gas stocks ranged from net injections of 75 Bcf to 94 Bcf, with a median estimate of 87 Bcf.
The average rate of net injections into storage is 27% higher than the five-year average so far in the refill season (April through October). If the rate of injections into storage matched the five-year average of 8.1 Bcf/d for the remainder of the refill season, total inventories would be 3,744 Bcf on October 31, which is 52 Bcf higher than the five-year average of 3,692 Bcf for that time of year.
More storage data and analysis can be found on the Natural Gas Storage Dashboard and the Weekly Natural Gas Storage Report.
See also:


| Spot Prices ($/MMBtu) | Thu, 24-Oct |
Fri, 25-Oct |
Mon, 28-Oct |
Tue, 29-Oct |
Wed, 30-Oct |
|---|---|---|---|---|---|
| Henry Hub | 2.26 | 2.15 | 2.39 | 2.56 | 2.67 |
| New York | 1.80 | 1.56 | 1.96 | 1.88 | 1.87 |
| Chicago | 2.25 | 2.12 | 2.50 | 2.65 | 2.69 |
| Cal. Comp. Avg.* | 2.89 | 2.80 | 3.12 | 3.38 | 3.45 |
| Futures ($/MMBtu) | |||||
| November Contract | 2.316 | 2.300 | 2.446 | 2.597 | Expired |
| December Contract | 2.465 | 2.459 | 2.555 | 2.639 | 2.691 |
| January Contract | 2.567 | 2.561 | 2.647 | 2.724 | 2.781 |
| *Avg. of NGI's reported prices for: Malin, PG&E Citygate, and Southern California Border Avg. | |||||
| Source: NGI's Daily Gas Price Index | |||||


| U.S. natural gas supply - Gas Week: (10/24/19 - 10/30/19) | |||
|---|---|---|---|
Average daily values (Bcf/d): |
|||
this week |
last week |
last year |
|
| Marketed production | 107.5 |
107.5 |
98.9 |
| Dry production | 94.8 |
94.8 |
87.2 |
| Net Canada imports | 4.3 |
4.1 |
4.1 |
| LNG pipeline deliveries | 0.1 |
0.1 |
0.1 |
| Total supply | 99.1 |
99.0 |
91.3 |
|
Source: IHS Markit | |||
| U.S. natural gas consumption - Gas Week: (10/24/19 - 10/30/19) | |||
|---|---|---|---|
Average daily values (Bcf/d): |
|||
this week |
last week |
last year |
|
| U.S. consumption | 65.4 |
64.3 |
66.9 |
| Power | 30.2 |
30.6 |
26.1 |
| Industrial | 21.1 |
20.4 |
22.9 |
| Residential/commercial | 14.1 |
13.3 |
17.9 |
| Mexico exports | 5.3 |
5.3 |
4.9 |
| Pipeline fuel use/losses | 6.4 |
6.4 |
6.1 |
| LNG pipeline receipts | 7.1 |
6.9 |
3.8 |
| Total demand | 84.3 |
82.8 |
81.8 |
|
Source: IHS Markit | |||


| Rigs | |||
|---|---|---|---|
Tue, October 22, 2019 |
Change from |
||
last week |
last year |
||
| Oil rigs | 696 |
-2.4% |
-20.5% |
| Natural gas rigs | 133 |
-2.9% |
-31.1% |
| Note: Excludes any miscellaneous rigs | |||
| Rig numbers by type | |||
|---|---|---|---|
Tue, October 22, 2019 |
Change from |
||
last week |
last year |
||
| Vertical | 51 |
0.0% |
-25.0% |
| Horizontal | 728 |
-2.3% |
-21.5% |
| Directional | 51 |
-7.3% |
-30.1% |
| Source: Baker Hughes Inc. | |||
| Working gas in underground storage | ||||
|---|---|---|---|---|
Stocks billion cubic feet (Bcf) |
||||
| Region | 2019-10-25 |
2019-10-18 |
change |
|
| East | 913 |
898 |
15 |
|
| Midwest | 1,095 |
1,069 |
26 |
|
| Mountain | 211 |
208 |
3 |
|
| Pacific | 298 |
297 |
1 |
|
| South Central | 1,178 |
1,134 |
44 |
|
| Total | 3,695 |
3,606 |
89 |
|
|
Source: Form EIA-912, Weekly Underground Natural Gas Storage Report | ||||
| Working gas in underground storage | |||||
|---|---|---|---|---|---|
Historical comparisons |
|||||
Year ago (10/25/18) |
5-year average (2014-2018) |
||||
| Region | Stocks (Bcf) |
% change |
Stocks (Bcf) |
% change |
|
| East | 826 |
10.5 |
895 |
2.0 |
|
| Midwest | 953 |
14.9 |
1,057 |
3.6 |
|
| Mountain | 180 |
17.2 |
211 |
0.0 |
|
| Pacific | 262 |
13.7 |
324 |
-8.0 |
|
| South Central | 916 |
28.6 |
1,156 |
1.9 |
|
| Total | 3,136 |
17.8 |
3,643 |
1.4 |
|
| Source: Form EIA-912, Weekly Underground Natural Gas Storage Report | |||||
| Temperature – heating & cooling degree days (week ending Oct 24) | ||||||||
|---|---|---|---|---|---|---|---|---|
HDD deviation from: |
CDD deviation from: |
|||||||
| Region | HDD Current |
normal |
last year |
CDD Current |
normal |
last year |
||
| New England | 96 |
-17 |
-51 |
0 |
0 |
0 |
||
| Middle Atlantic | 88 |
-14 |
-40 |
0 |
0 |
0 |
||
| E N Central | 94 |
-15 |
-52 |
0 |
-1 |
0 |
||
| W N Central | 111 |
2 |
-11 |
0 |
-1 |
0 |
||
| South Atlantic | 54 |
-5 |
-23 |
31 |
9 |
4 |
||
| E S Central | 54 |
-4 |
-25 |
2 |
-5 |
1 |
||
| W S Central | 23 |
-2 |
-19 |
29 |
6 |
20 |
||
| Mountain | 117 |
13 |
37 |
8 |
0 |
-2 |
||
| Pacific | 23 |
-19 |
8 |
13 |
8 |
9 |
||
| United States | 71 |
-9 |
-22 |
12 |
4 |
4 |
||
|
Note: HDD = heating degree day; CDD = cooling degree day Source: National Oceanic and Atmospheric Administration | ||||||||
Average temperature (°F)
7-day mean ending Oct 24, 2019

Source: National Oceanic and Atmospheric Administration
Deviation between average and normal (°F)
7-day mean ending Oct 24, 2019
Source: National Oceanic and Atmospheric Administration
