In the News:
Corn crop maturity suggests late harvest and high heating fuel demand this winter
Indicators reported by the U.S. Department of Agriculture (USDA), the National Oceanic and Atmospheric Administration (NOAA), and other agencies suggest demand for heating fuels during the 2019 grain drying season may rise higher than the five-year average for the first time since 2013. Although crops are still about two months away from harvest, the combination of expected wet, late corn crops; relatively high grain prices; and relatively low propane prices suggest strong propane demand during this year’s grain drying season.
Demand for heating fuel for drying corn grain in commercial dryers―instead of in the field―is affected by several factors:
- Moisture content of harvested grain—corn kernels sold into the wholesale market must have a moisture content within allowable limits.
- Harvest time—the later the harvest, the less likely producers are to leave the corn to dry in the field, and the possibility of frost and precipitation increases.
- Producer economics—wholesale corn grain prices may or may not be high enough to allow producers to spend additional funds on commercial grain drying.
- Cost of fuel—producers use either natural gas or propane in commercial dryers.
The USDA surveys producers to capture several corn maturity indicators, and they report these indicators weekly. After emergence, when seeds sprout, the USDA’s National Agricultural Statistics Service reports four stages of corn grain development:
- Silking—about 9 to 10 weeks after emergence
- Dough—about 3 weeks after the silking stage
- Dent—about 1 week after the dough stage
- Mature—about 3 to 5 weeks after the dent stage
The USDA reported that corn crops are reaching the dough stage one to two weeks later than the 5-year average in the seven Midwest (PADD 2) states with the highest grain drying fuel demand (Illinois, Indiana, Iowa, Minnesota, North Dakota, South Dakota, and Wisconsin). However, this year’s crops appear to be catching up. Emergence occurred about five weeks behind the five-year average, and silking was only about three weeks behind the five-year average.
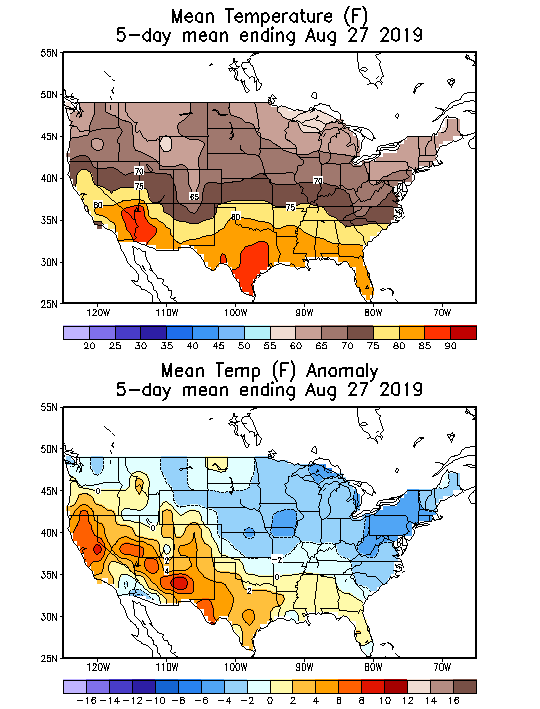
NOAA’s National Weather Service 30-day forecast suggests that in September―when corn crops should be reaching maturity―corn-growing states will experience weather that is both cooler and wetter than normal. This weather could slow the crop’s maturing process and increase the moisture that must be removed during the drying process.
The USDA projects 13.9 billion bushels of corn will be harvested in 2019—less than in the previous three years but slightly higher than the 13.8 billion bushels harvested in 2013. The relatively small corn crop, combined with lower corn inventories, has resulted in higher average futures prices for December corn delivery than at any time since 2013. Midwest propane prices, on the other hand, as reported at Conway, Kansas, are at multi-year lows, averaging less than 35 cents per gallon so far this August, less than one-half the price in August 2018 and less than one-third the price in August 2013.
Overview:
(For the week ending Wednesday, August 28, 2019)
- Natural gas spot prices fell at most locations this report week (Wednesday, August 21 to Wednesday, August 28). Henry Hub spot prices dropped slightly from $2.25 per million British thermal units (MMBtu) last Wednesday to $2.24/MMBtu yesterday.
- At the New York Mercantile Exchange (Nymex), the September 2019 contract expired yesterday at $2.251/MMBtu, up 8¢/MMBtu from last Wednesday. The October 2019 contract increased to $2.222/MMBtu, up 4¢/MMBtu from last Wednesday to yesterday. The price of the 12-month strip averaging October 2019 through September 2020 futures contracts climbed 3¢/MMBtu to $2.373/MMBtu.
- Net injections to working gas totaled 60 billion cubic feet (Bcf) for the week ending August 23. Working natural gas stocks are 2,857 Bcf, which is 15% more than the year-ago level and 3% lower than the five-year (2014–18) average for this week.
- The natural gas plant liquids composite price at Mont Belvieu, Texas, rose by 27¢/MMBtu, averaging $4.37/MMBtu for the week ending August 28. The price of natural gasoline fell by 2%. The prices of ethane, butane, isobutane, and propane, rose by 16%, 13%, 10%, and 5%, respectively.
- According to Baker Hughes, for the week ending Tuesday, August 20, the natural gas rig count decreased by 3 to 162. The number of oil-directed rigs fell by 16 to 754. The total rig count decreased by 19, and it now stands at 916.
Prices/Supply/Demand:
Prices fall at most locations amid mixed temperatures. This report week (Wednesday, August 21 to Wednesday, August 28), Henry Hub spot prices traded within a narrow range and fell 1¢ from $2.25/MMBtu last Wednesday to $2.24/MMBtu yesterday. Temperatures were cooler than normal across most of the northern part of the country and warmer than normal across California and the southern United States. At the Chicago Citygate, prices decreased 5¢ from $2.08/MMBtu last Wednesday to $2.03/MMBtu yesterday.
California prices rise with warmer than normal temperatures. Prices at PG&E Citygate in Northern California rose 34¢, up from $2.66/MMBtu last Wednesday to $3.00/MMBtu yesterday. Prices at SoCal Citygate increased 75¢ from $2.65/MMBtu last Wednesday to $3.40/MMBtu yesterday.
Northeast prices fall with cooler temperatures and lower consumption. At the Algonquin Citygate, which serves Boston-area consumers, prices went down 14¢ from $2.19/MMBtu last Wednesday to $2.05/MMBtu yesterday as demand across all sectors, especially the electric power sector, decreased. At the Transcontinental Pipeline Zone 6 trading point for New York City, prices decreased 26¢ from $2.05/MMBtu last Wednesday to $1.79/MMBtu yesterday.
Tennessee Zone 4 Marcellus spot prices decreased 6¢ from $1.72/MMBtu last Wednesday to $1.66/MMBtu yesterday. Prices at Dominion South in southwest Pennsylvania fell 6¢ from $1.80/MMBtu last Wednesday to $1.74/MMBtu yesterday.
Permian Basin prices strengthen throughout the week. Prices at the Waha Hub in West Texas, which is located near Permian Basin production activities, averaged $0.97/MMBtu last Wednesday, $1.28/MMBtu lower than Henry Hub prices. Yesterday, prices at the Waha Hub reached a weekly high of $1.22/MMBtu, $1.02/MMBtu lower than Henry Hub prices. Prices remained in positive territory week over week as the Gulf Coast Express Pipeline prepares to enter service ahead of its announced in-service date of October 1.
Florida braces for Hurricane Dorian. Hurricane Dorian is on track to hit the Florida East Coast over the coming holiday weekend. EIA’s mapping tool will track energy infrastructure in the hurricane’s path, and EIA’s Hourly Electric Grid Monitor will show outages. Potential impacts from Hurricane Dorian are expected to be demand-related, according to S&P Global Platts, because power outages in the Southeast may result in decreased power burn. Production in the Gulf of Mexico could also be affected, depending on the path of the storm.
Supply falls. According to data from IHS Markit, the total U.S. supply of natural gas fell by 1% compared with the previous report week. Dry natural gas production remained constant week over week. Net imports from Canada decreased by 15% from last week.
Demand falls. Total U.S. consumption of natural gas fell by 4% compared with the previous report week, according to data from IHS Markit. Natural gas consumed for power generation declined by 9% week over week. Industrial sector consumption increased by 2% week over week. In the residential and commercial sectors, consumption increased by 1%. Natural gas exports to Mexico were the same as last week, averaging 5.1 Bcf/d.
Exports to Mexico set to increase as new pipeline enters service. EIA expects flows to Mexico to increase after Mexico’s utility Comisión Federal de Electricidad announced on Tuesday that it had renegotiated contracts with three pipeline companies. The first pipeline to begin operations, within the next few days, will be the 2.6 Bcf/d South Texas-Tuxpan marine gas pipeline, which will ultimately serve 14 power generation plants in Southeast and Central Mexico.
U.S. LNG exports decrease week over week. Eight liquid natural gas (LNG) vessels (five from Sabine Pass, and one each from Cove Point, Corpus Christi, and Cameron LNG export terminals) with a combined LNG-carrying capacity of 30 Bcf departed the United States between August 22 and August 28, according to shipping data compiled by Bloomberg. One vessel was loading at the Corpus Christi terminal on Wednesday.
Cheniere Energy, the developer of the Sabine Pass and Corpus Christi LNG export terminals, received a letter order from the Federal Energy Regulatory Commission allowing them to place Corpus Christi Train 2 into commercial operation. The first cargo from Train 2 was shipped in July 2019.
Storage:
Net injections into storage totaled 60 Bcf for the week ending August 23, compared with the five-year (2014–18) average net injections of 57 Bcf and last year's net injections of 66 Bcf during the same week. Working gas stocks totaled 2,857 Bcf, which is 100 Bcf lower than the five-year average and 363 Bcf more than last year at this time.
According to The Desk survey of natural gas analysts, estimates of the weekly net change from working natural gas stocks ranged from net injections of 56 Bcf to 65 Bcf, with a median estimate of 61 Bcf.
The average rate of net injections into storage is 30% higher than the five-year average so far in the refill season (April through October). If the rate of injections into storage matched the five-year average of 10.7 Bcf/d for the remainder of the refill season, total inventories would be 3,592 Bcf on October 31, which is 100 Bcf lower than the five-year average of 3,692 Bcf for that time of year.
More storage data and analysis can be found on the Natural Gas Storage Dashboard and the Weekly Natural Gas Storage Report.
See also:


| Spot Prices ($/MMBtu) | Thu, 22-Aug |
Fri, 23-Aug |
Mon, 26-Aug |
Tue, 27-Aug |
Wed, 28-Aug |
|---|---|---|---|---|---|
| Henry Hub |
2.22 |
2.13 |
2.22 |
2.18 |
2.24 |
| New York |
1.71 |
1.45 |
1.70 |
1.78 |
1.79 |
| Chicago |
1.98 |
1.87 |
2.00 |
1.94 |
2.03 |
| Cal. Comp. Avg.* |
2.16 |
2.08 |
2.57 |
2.82 |
2.67 |
| Futures ($/MMBtu) | |||||
| September contract | 2.159 |
2.152 |
2.230 |
2.202 |
2.251 |
| October contract |
2.163 |
2.156 |
2.233 |
2.192 |
2.222 |
| *Avg. of NGI's reported prices for: Malin, PG&E Citygate, and Southern California Border Avg. | |||||
| Sources: Natural Gas Intelligence and CME Group as compiled by Bloomberg, L.P. | |||||


| U.S. natural gas supply - Gas Week: (8/22/19 - 8/28/19) | |||
|---|---|---|---|
Average daily values (Bcf/d): |
|||
this week |
last week |
last year |
|
| Marketed production | 103.6 |
103.8 |
95.3 |
| Dry production | 92.3 |
92.4 |
85.5 |
| Net Canada imports | 4.0 |
4.7 |
4.9 |
| LNG pipeline deliveries | 0.1 |
0.1 |
0.1 |
| Total supply | 96.3 |
97.1 |
90.5 |
|
Source: IHS Markit | |||
| U.S. natural gas consumption - Gas Week: (8/22/19 - 8/28/19) | |||
|---|---|---|---|
Average daily values (Bcf/d): |
|||
this week |
last week |
last year |
|
| U.S. consumption | 67.5 |
70.5 |
65.0 |
| Power | 37.1 |
40.7 |
35.9 |
| Industrial | 21.7 |
21.2 |
21.3 |
| Residential/commercial | 8.7 |
8.6 |
7.8 |
| Mexico exports | 5.1 |
5.1 |
5.0 |
| Pipeline fuel use/losses | 6.4 |
6.5 |
6.0 |
| LNG pipeline receipts | 6.4 |
4.8 |
3.1 |
| Total demand | 85.4 |
86.9 |
79.0 |
|
Source: IHS Markit | |||


| Rigs | |||
|---|---|---|---|
Tue, August 20, 2019 |
Change from |
||
last week |
last year |
||
| Oil rigs | 754 |
-2.1% |
-12.3% |
| Natural gas rigs | 162 |
-1.8% |
-11.0% |
| Note: Excludes any miscellaneous rigs | |||
| Rig numbers by type | |||
|---|---|---|---|
Tue, August 20, 2019 |
Change from |
||
last week |
last year |
||
| Vertical | 50 |
-3.8% |
-20.6% |
| Horizontal | 797 |
-2.2% |
-13.3% |
| Directional | 69 |
1.5% |
11.3% |
| Source: Baker Hughes Inc. | |||
| Working gas in underground storage | ||||
|---|---|---|---|---|
Stocks billion cubic feet (Bcf) |
||||
| Region | 2019-08-23 |
2019-08-16 |
change |
|
| East | 682 |
660 |
22 |
|
| Midwest | 790 |
760 |
30 |
|
| Mountain | 173 |
168 |
5 |
|
| Pacific | 278 |
274 |
4 |
|
| South Central | 934 |
935 |
-1 |
|
| Total | 2,857 |
2,797 |
60 |
|
|
Source: Form EIA-912, Weekly Underground Natural Gas Storage Report | ||||
| Working gas in underground storage | |||||
|---|---|---|---|---|---|
Historical comparisons |
|||||
Year ago (8/23/18) |
5-year average (2014-2018) |
||||
| Region | Stocks (Bcf) |
% change |
Stocks (Bcf) |
% change |
|
| East | 633 |
7.7 |
712 |
-4.2 |
|
| Midwest | 664 |
19.0 |
783 |
0.9 |
|
| Mountain | 156 |
10.9 |
185 |
-6.5 |
|
| Pacific | 240 |
15.8 |
297 |
-6.4 |
|
| South Central | 801 |
16.6 |
980 |
-4.7 |
|
| Total | 2,494 |
14.6 |
2,957 |
-3.4 |
|
| Source: Form EIA-912, Weekly Underground Natural Gas Storage Report | |||||
| Temperature – heating & cooling degree days (week ending Aug 22) | ||||||||
|---|---|---|---|---|---|---|---|---|
HDD deviation from: |
CDD deviation from: |
|||||||
| Region | HDD Current |
normal |
last year |
CDD Current |
normal |
last year |
||
| New England | 0 |
-4 |
-1 |
62 |
32 |
15 |
||
| Middle Atlantic | 0 |
-3 |
-1 |
81 |
37 |
19 |
||
| E N Central | 1 |
-5 |
-1 |
59 |
17 |
6 |
||
| W N Central | 3 |
-4 |
-1 |
60 |
4 |
11 |
||
| South Atlantic | 0 |
-1 |
0 |
114 |
27 |
11 |
||
| E S Central | 0 |
0 |
0 |
106 |
22 |
14 |
||
| W S Central | 0 |
0 |
0 |
147 |
28 |
16 |
||
| Mountain | 1 |
-8 |
-7 |
87 |
19 |
11 |
||
| Pacific | 1 |
-3 |
1 |
48 |
5 |
-19 |
||
| United States | 1 |
-3 |
-1 |
85 |
20 |
8 |
||
|
Note: HDD = heating degree day; CDD = cooling degree day Source: National Oceanic and Atmospheric Administration | ||||||||
Average temperature (°F)
7-day mean ending Aug 22, 2019

Source: National Oceanic and Atmospheric Administration
Deviation between average and normal (°F)
7-day mean ending Aug 22, 2019
Source: National Oceanic and Atmospheric Administration
