In the News:
As record setting cold blasts the East, western temperatures warmer than normal
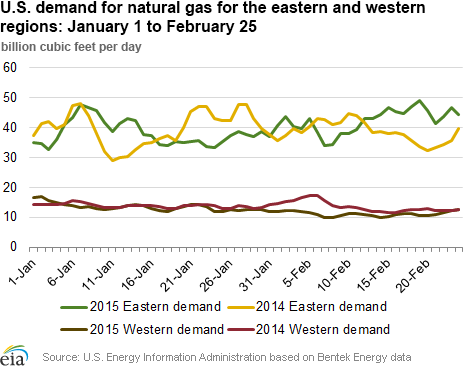
When looking at the nation as a whole, since the start of the year, natural gas consumption has remained relatively flat and temperatures, on average, have been close to normal. Regionally, however, there is a stark difference between the eastern and western halves of the country.
Nationally, natural gas consumption from January 1 through February 20 was 2% higher this year compared to last year, with 6 of the top 20 U.S. natural gas consumption-days occurring during that period, according to data from Bentek Energy. Driven by regional weather patterns, consumption was up 4% in the eastern half of the country (Northeast, Southeast, and Midwest) over last year, but was down 9% in the West (Northwest, Rockies, and Southwest) during that period. In particular, Texas and the Southeast saw increasing demand, mostly due to power burn for space heating, of more than 10% during this period over the year-ago period.
Since the start of the year, record cold temperatures and significant snowfall have occurred in the eastern half of the country. Long-standing temperature records tumbled east of the Rockies, and cumulative heating degree days from January 1 through February 20 equaled 2,220, 11% more than normal. This is in contrast to the western half of the nation where daily temperatures have often been above average. Seven states — California, Idaho, Nevada, Oregon, Utah, Washington, and Wyoming — have reported average temperatures for the month of January in the top 10 warmest on record, with cumulative HDD since the beginning of the year totaling 922, 25% under normal.
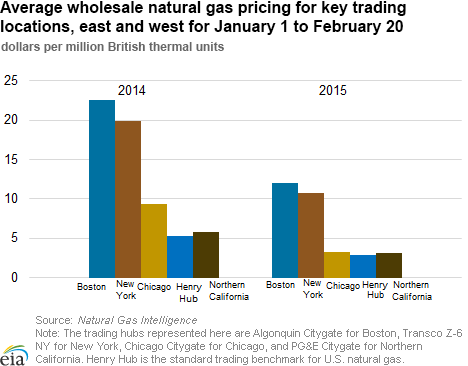
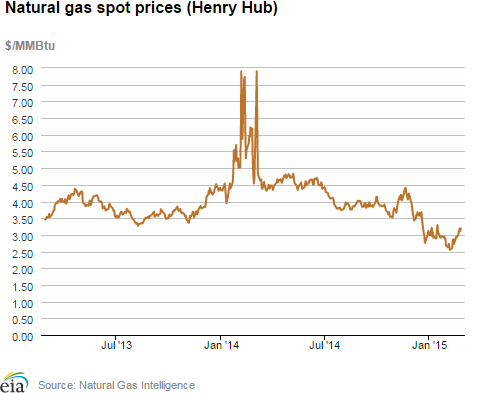
With lower demand, spot volumes in the West have traded this year near or below that of the Henry Hub price, the U.S. natural gas benchmark, which averaged $2.88 per million British thermal units (MMBtu) January 1 to February 20. Average spot pricing for PG&E Citygate in California, Opal in Wyoming, and Northwest Sumas in Washington were $3.10/MMBtu, $2.64/MMBtu, and $2.54/MMBtu, respectively, for that period and much less than the key Northeast trading hubs, which have been trading four or more times higher than the West. For many locations in the East average prices from January 1 through February 20 were above $10/MMBtu, climbing on peak days to $11.51/MMBtu at Chicago Citygate, $38.15/MMBtu at Transcontinental Zone 6 for New York City, and $23.51/MMBtu at Algonquin Citygate (Boston). Since February 20, prices at Algonquin Citygate have risen even higher, settling at $29.99/MMBtu on February 24, as cold weather persists.
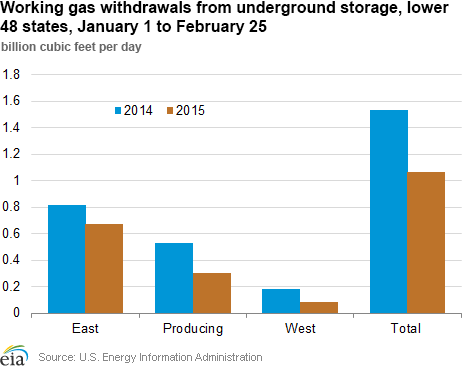
The differences in consumption have also been reflected in natural gas storage activity since January 1. Since the start of the year, the East region has pulled 5% more gas from storage than the five-year average withdrawals. In contrast, the West region has withdrawn 7% less gas over that period compared to its five-year average. Storage withdrawals across all regions, since January 1, are less than recorded last winter, which is attributed to higher levels of production and imports this year.
Overview:
(For the Week Ending Wednesday, February 25, 2015)
- Natural gas prices increased at most market locations through the report week (Wednesday to Wednesday), as much of the country continued to experience cold temperatures. The Henry Hub spot price posted a 26¢ (9%) gain from $2.93/MMBtu on Wednesday, February 18, to $3.19/MMBtu on Wednesday, February 25.
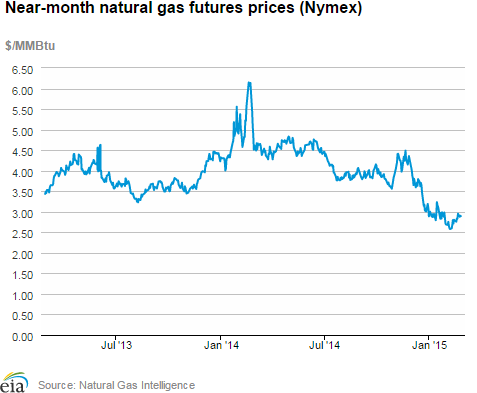
- At the New York Mercantile Exchange (Nymex), the price of the March 2015 futures remained below $3/MMBtu, opening the report week at $2.831/MMBtu and settling at $2.894/MMBtu yesterday. The 12-month strip, which averages the March 2015 through February 2016 contracts, remained essentially unchanged closing the week at $2.952/MMBtu yesterday.
- Working natural gas in storage decreased to 1,938 Bcf as of Friday, February 20, according to the U.S. Energy Information Administration (EIA) Weekly Natural Gas Storage Report (WNGSR). A net withdrawal from storage of 219 Bcf for the week resulted in storage levels 42.3% above year-ago levels and 1.5% below the five-year average for this week.
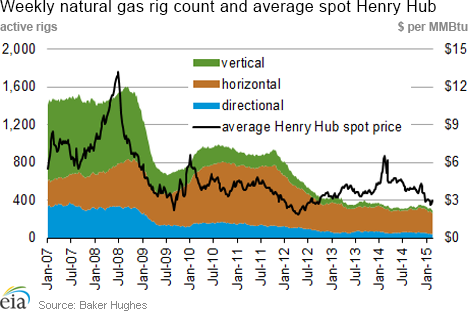
- The total U.S. rotary rig count continued to decline but at half the rate of recent weeks, dropping 48 units to 1,310 active units, 461 below the year-ago count, according to data reported by Baker Hughes Inc. The natural gas rig count fell by 11 units to 289, while the oil rig count fell by 37 units to 1,019. The largest declines occurred in the Permian and Eagle Ford basins, where rigs fell by 125 and 61 units, respectively.
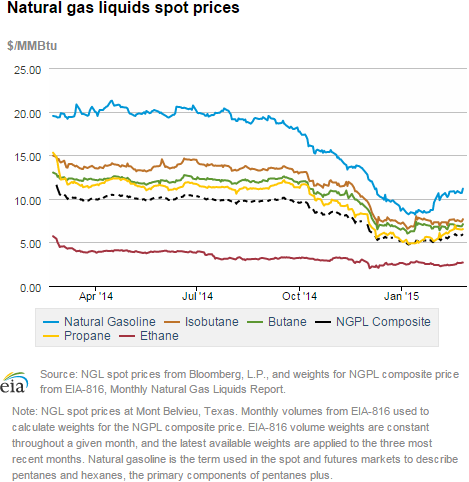
- The natural gas plant liquids composite price increased by 30¢ to $5.87/MMBtu for the week ending February 20. All Mont Belvieu NGL spot prices were up this week, led by the 9% increase in propane prices from $6.10/MMBtu to $6.65/MMBtu, as severe cold weather continued in many regions across the country increasing demand for home heating fuel. The ethane and natural gasoline spot prices increased by 5.3% and 2.7%, respectively, while butane increased by 2.8% and isobutane by 3.0%.
Prices/Demand/Supply:
Prices across most U.S. regions increased week-over-week.The largest increase in prices occurred in the Northeast, as continued cold temperatures and snow accumulation were setting records, particularly in the New England states. Prices were elevated at most trading hubs with the exception of the Midwest, where prices originally spiked on Wednesday last week and then moderated by the end of the report week. Friday, February 20, saw a significant decline in prices in the East, Northeast, and Midwest as power loads eased and temperatures moderated, but prices increased again by the end of the report week as the new cold weather system moved into most areas east of the Rockies. Prices at Henry Hub increased, from $2.93/MMBtu to $3.19/MMBtu, reflecting higher demand in the Southeast.
Prices in the Northeast remain at seasonal highs as cold spell continues. As the cold spell continued in the Northeast with more snow and record low temperatures, natural gas spot prices hit new seasonal highs, although these levels remained below record price spikes of last year. Prices at the New England trading hubs remained volatile amid choppy trading, starting last Wednesday around $20/MMBtu, declining by almost 50% by Friday, rising back to hit seasonal records on Tuesday, then moderating slightly yesterday. For example, prices at the Algonquin Citygate serving Boston area consumers began the report week at $21.37/MMBtu, declined to $13.53/MMBtu by Friday, hit a seasonal record at $29.99/MMBtu on Tuesday and closed at $25.42/MMBtu yesterday. Similarly, at Tennessee Zone 6 200 Line, which includes all points in Rhode Island, Massachusetts, and New Hampshire, prices declined by almost 50% to $10.98/MMBtu on Friday, before rebounding to $25.44/MMBtu yesterday.
Prices at the other northeastern trading hubs also showed considerable volatility and remained high as the cold spell continued, even as new storm system was expected to move into the region today.At Transcontinental Pipeline's Zone 6 trading point for delivery into New York City, prices spiked to $38.15/MMBtu last Wednesday, then steadily declined in the next few days to reach $13.83/MMBtu by Tuesday, and closed the report week at $23.36/MMBtu. At Texas Eastern Transmission's M-3 trading point, which serves Mid-Atlantic customers in New Jersey and Pennsylvania, prices started the report week at $19.95/MMBtu, then fell to $10.02/MMBtu by Tuesday, and settled at $19.32/MMBtu yesterday.
Marcellus-area prices are mixed and remain low. Most Marcellus-area prices declined during the report week, and remained far below the rest of the country. Prices at Tennessee's Zone 4 trading region, which represents Marcellus deliveries on Tennessee's system, remained unchanged at $1.50/MMBtu. Prices at Dominion South, which serves customers in portions of Pennsylvania, Ohio, Maryland, West Virginia, and Virginia rose briefly on Monday to $3.16/MMBtu, but declined by Wednesday to $2.87/MMBtu. At the Leidy Hub, which represents deliveries into several pipeline systems in the upper west-central portion of Pennsylvania, prices declined from $1.63/MMBtu last Wednesday to $1.58/MMBtu yesterday.
Prices in the Midwest moderate. Severe winter weather that swept into the Midwest in the previous week led to price spikes at all trading hubs in the region by the middle of last week. Prices at Chicago Citygate hit $11.51/MMBtu last Wednesday, a seasonal high this winter, moderating to $6.81/MMBtu by Friday, and then declining further in the next few days to close the week at $4.62/MMBtu. Prices at other trading hubs followed a similar pattern, spiking last Wednesday and then declining by 50%-60%, with the Midwest regional average closing yesterday at $4.84/MMBtu, down $6.35/MMBtu over the report week.
Nymex March contract price remains below $3/MMBtu. Despite expectations of a large storage withdrawal, the Nymex March 2015 contract closed the week below $3/MMBtu. The contract began the report week at $2.831/MMBtu last Wednesday and increased slightly to close the report week yesterday at $2.894/MMBtu, when March expired as the prompt month contract. The April contract on Wednesday settled lower than March at $2.862. April became the prompt month contract today. The 12-month strip, which averages the March 2015 through February 2016 contracts, remained essentially unchanged, starting the report week at $2.949/MMBtu and closing yesterday at $2.952/MMBtu.
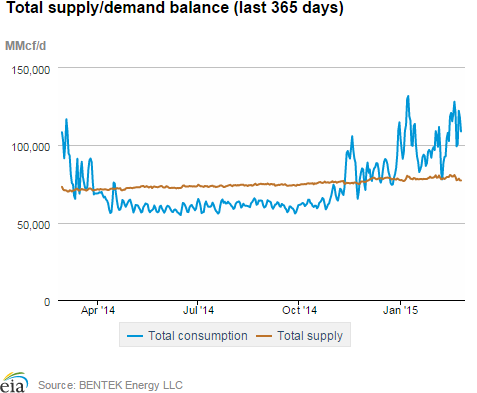
Demand remains at high levels. U.S. natural gas consumption averaged 111.6 Bcf/d for the report week, peaking on Thursday at 125.7 Bcf/d, according to data from Bentek Energy. The residential/commercial sector led the growth in demand, increasing by 1.6% week-over-week and averaging 61.6 Bcf/d, 57% higher than in the same week of last year. Gas consumption in the electric sector increased by 0.1%, while industrial consumption registered a slight decline of 0.5% compared to the previous week. Exports to Mexico were also elevated, up 10% to average 2.5 Bcf/d.
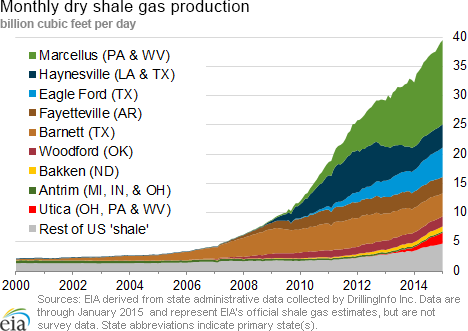
U.S. dry gas production declines slightly during the report week. Total supply averaged 78.4 Bcf/d, a 1.9% decline over the previous week, and was 10% higher than a year-ago level, according to data from Bentek Energy. Dry gas production fell by 1.6% over the report week, and averaged 72 Bcf/d. Some of the declines in supply were due to freeze-offs in Ohio and Pennsylvania. Production also decreased in Southeast/Gulf region, where supply averaged 15.1 Bcf/d, 3.5% below the previous week. This may also be attributed to freeze-offs, although there were no direct reports of them occurring in that region. Imports of natural gas from Canada decreased this week, averaging 6.0 Bcf/d over the report period, led by declines in the Northeast and West. LNG sendout also decreased by 25% and averaged 0.8 Bcf/d.
Storage
Storage inventories fall below five-year average. After surpassing their five-year average last week for the first time since November 22, 2013, and after larger-than-average withdrawals this week, natural gas inventories are once again below their five-year average. Following a net withdrawal of 219 Bcf for the week, working gas inventories as of February 20 totaled 1,938 Bcf, 576 Bcf (42.3%) higher than last year at this time and 30 Bcf (1.5%) lower than the five-year (2010-14) average. The 219-Bcf net withdrawal reported for the week was higher than both the five-year average and last year's net withdrawals for the week ending February 20, which were 131 Bcf and 117 Bcf, respectively.
Storage withdrawals far lower than market expectations. Market expectations, on average, called for a pull of 239 Bcf. When the EIA storage report was released at 10:30 a.m. on February 26, the price for the March natural gas futures contract decreased 6¢, to $2.74/MMBtu, in trading on the Nymex. In the next hour, prices decreased further, trading around $2.70/MMBtu. The April contract settled at $2.697, down 16.5¢.
The West is the only region with a surplus to five-year average. With a 74-Bcf storage withdrawal this week, the Producing region is back below its five-year average. Salt facilities in that region remain above their five-year average by 44 Bcf, nearly half of their 80-Bcf surplus from the week before. The deficit to their five-year average from nonsalt facilities in the Producing region also grew this week, and is now 59 Bcf (9.8%) below the five-year average. The West region is above its five-year average level by 69 Bcf. Storage levels for the East, West, and Producing regions were above their year-ago levels by 225 Bcf, 152 Bcf, and 199 Bcf, respectively.
Temperatures during the storage report week are significantly cooler than normal. Temperatures in the Lower 48 states averaged 27.4° for the storage report week, 18.0° cooler than the 30-year normal temperature and 13.7° cooler than the average temperature during the same week last year. There were 263 population-weighted heating degree days during the storage report week, 75 higher than the 5-year average and 67 higher than during the same period last year.
Natural gas storage capacity remains relatively unchanged year-over-year. In a recently released EIA report, both natural gas storage design capacity and demonstrated peak capacity grew less than 1% from 2013 to 2014. With natural gas storage inventories at low levels in most of 2014 and production relatively high, minimal new natural gas storage capacity was built in 2014, except for salt facilities in the Producing region.
See also:

| Spot Prices ($/MMBtu) | Thu, 19-Feb |
Fri, 20-Feb |
Mon, 23-Feb |
Tue, 24-Feb |
Wed, 25-Feb |
|---|---|---|---|---|---|
| Henry Hub |
2.97 |
2.98 |
3.19 |
3.12 |
3.19 |
| New York |
21.65 |
19.96 |
23.03 |
13.83 |
23.36 |
| Chicago |
6.71 |
6.81 |
4.47 |
4.35 |
4.62 |
| Cal. Comp. Avg,* |
2.82 |
2.95 |
3.09 |
2.95 |
3.03 |
| Futures ($/MMBtu) | |||||
| March contract |
2.834 |
2.951 |
2.879 |
2.902 |
2.894 |
| April contract |
2.875 |
2.972 |
2.893 |
2.889 |
2.862 |
| *Avg. of NGI's reported prices for: Malin, PG&E citygate, and Southern California Border Avg. | |||||
| Source: NGI's Daily Gas Price Index | |||||
| U.S. natural gas supply - Gas Week: (2/18/15 - 2/25/15) | ||
|---|---|---|
Percent change for week compared with: |
||
last year |
last week |
|
| Gross production | 7.72%
|
-1.62%
|
| Dry production | 7.65%
|
-1.61%
|
| Canadian imports | 31.69%
|
-1.73%
|
| West (net) | 40.18%
|
-2.38%
|
| Midwest (net) | -23.10%
|
1.87%
|
| Northeast (net) | 157.97%
|
-3.48%
|
| LNG imports | 355.96%
|
-25.04%
|
| Total supply | 10.06%
|
-1.94%
|
| Source: BENTEK Energy LLC | ||
| U.S. consumption - Gas Week: (2/18/15 - 2/25/15) | ||
|---|---|---|
Percent change for week compared with: |
||
last year |
last week |
|
| U.S. consumption | 42.6%
|
0.8%
|
| Power | 58.5%
|
0.1%
|
| Industrial | 5.9%
|
-0.5%
|
| Residential/commercial | 57.0%
|
1.6%
|
| Total demand | 42.6%
|
1.0%
|
| Source: BENTEK Energy LLC | ||
| Rigs | |||
|---|---|---|---|
Fri, February 20, 2015 |
Change from |
||
last week |
last year |
||
| Oil rigs | 1,019 |
-3.50% |
-28.49% |
| Natural gas rigs | 289 |
-3.67% |
-15.50% |
| Miscellaneous | 2 |
0.00% |
-50.00% |
| Rig numbers by type | |||
|---|---|---|---|
Fri, February 20, 2015 |
Change from |
||
last week |
last year |
||
| Vertical | 203 |
-3.33% |
-48.21% |
| Horizontal | 979 |
-4.49% |
-17.17% |
| Directional | 128 |
4.07% |
-35.03% |
| Source: Baker Hughes Inc. | |||
| Working gas in underground storage | ||||
|---|---|---|---|---|
Stocks billion cubic feet (bcf) |
||||
| Region | 2015-02-20 |
2015-02-13 |
change |
|
| East | 843 |
984 |
-141 |
|
| West | 371 |
375 |
-4 |
|
| Producing | 724 |
798 |
-74 |
|
| Total | 1,938 |
2,157 |
-219 |
|
| Source: U.S. Energy Information Administration | ||||
| Working gas in underground storage | |||||
|---|---|---|---|---|---|
Historical comparisons |
|||||
Year ago (2/20/14) |
5-year average (2010-2014) |
||||
| Region | Stocks (Bcf) |
% change |
Stocks (Bcf) |
% change |
|
| East | 618 |
36.4 |
928 |
-9.2 |
|
| West | 219 |
69.4 |
302 |
22.8 |
|
| Producing | 525 |
37.9 |
738 |
-1.9 |
|
| Total | 1,362 |
42.3 |
1,968 |
-1.5 |
|
| Source: U.S. Energy Information Administration | |||||
| Temperature -- heating & cooling degree days (week ending Feb 19) | ||||||||
|---|---|---|---|---|---|---|---|---|
HDD deviation from: |
CDD deviation from: |
|||||||
| Region | HDD Current |
normal |
last year |
CDD Current |
normal |
last year |
||
| New England | 369
|
112
|
80
|
0
|
0
|
0
|
||
| Middle Atlantic | 370
|
126
|
96
|
0
|
0
|
0
|
||
| E N Central | 396
|
132
|
93
|
0
|
0
|
0
|
||
| W N Central | 354
|
87
|
95
|
0
|
0
|
0
|
||
| South Atlantic | 264
|
105
|
99
|
2
|
-5
|
-2
|
||
| E S Central | 269
|
113
|
112
|
0
|
-1
|
0
|
||
| W S Central | 128
|
23
|
55
|
0
|
-4
|
-9
|
||
| Mountain | 153
|
-46
|
26
|
1
|
0
|
-3
|
||
| Pacific | 43
|
-58
|
-17
|
0
|
0
|
0
|
||
| United States | 263
|
66
|
67
|
0
|
-2
|
-2
|
||
|
Note: HDD = heating degree-day; CDD = cooling degree-day Source: National Oceanic and Atmospheric Administration | ||||||||
Average temperature (°F)
7-Day Mean ending Feb 19, 2015
Source: NOAA/National Weather Service
Deviation between average and normal (°F)
7-Day Mean ending Feb 19, 2015
Source: NOAA/National Weather Service