In the News:
Working gas inventory just after winter's mid-point near five-year average
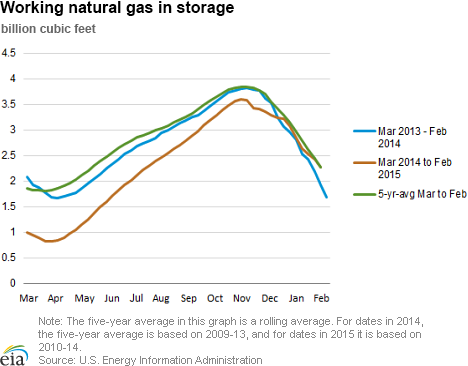
As of February 6, Lower 48 states natural gas working underground storage inventories are now only 11 billion cubic feet (Bcf), or 0.5%, less than their five-year average. After a record injection season (April-October), weekly working gas inventories reached a seasonal peak on November 7 of 3,611 Bcf, but were still 237 Bcf below the five-year average of 3,848 Bcf for that week.
Natural gas storage inventories have not exceeded their five-year average since November 22, 2013. Inventories, which ended the 2013-14 winter withdrawal season last March at a ten year record low of 837 Bcf, exceeded their year-ago inventory levels on December 12. While there had been several near-record withdrawals early this heating season, withdrawals so far this season have been significantly less than the record levels of last winter, and 16% less than the five-year average.
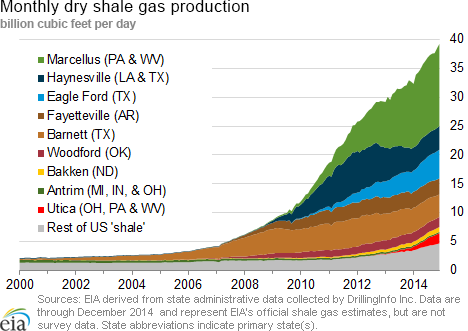
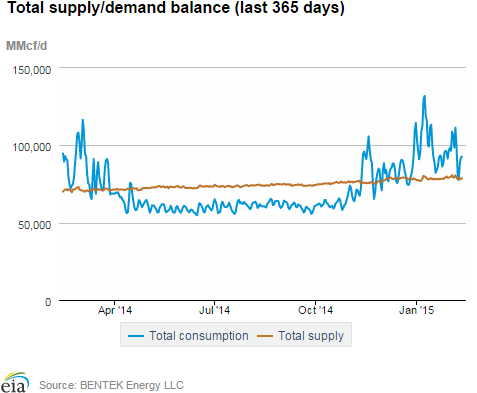
Increasing natural gas production has helped to displace some of the demand traditionally placed on storage during peak-use periods. Dry natural gas production has averaged 71.7 billion cubic feet per day (Bcf/d) since November 1, as reported by Bentek Energy, approximately 6.3 Bcf/d more than production for the same period last winter. This higher level of production is forecast to continue through the end of the heating season. EIA's Short-Term Energy Outlook forecasts that production will average 72.7 Bcf/d, February through March, 5.0 Bcf/d higher than the same period in 2014.
Lower natural gas consumption this winter also has reduced demands on storage. Above-average temperatures experienced in the western half of the United States so far this winter have offset the effects of colder weather in other parts of the country, and have dampened overall natural gas consumption. According to data from Bentek Energy, since November 1, U.S. natural gas consumption has averaged 86.9 Bcf/d, 4.8 Bcf/d lower than the same period last year. With closer-to-normal temperatures reducing residential and commercial consumption, EIA forecasts that total natural gas consumption in the United States will average 88.1 Bcf/d for the remainder of the heating season (February-March) in 2015, compared with an estimated 90.9 Bcf/d during that period in 2014.
Regaining storage parity with the five-year average working gas storage volume and continued growing production leaves natural gas inventories in a strong position to meet demand for the remainder of the winter. EIA projects that end-of-March 2015 inventories will total 1,699 Bcf, 43 Bcf more than the five-year average, and more than double the 837 Bcf level of March 2014.
Overview:
(For the Week Ending Wednesday, February 11, 2015)
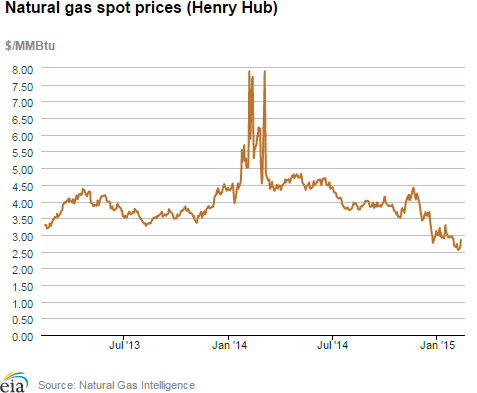
- Natural gas prices rose at most market locations through the Wednesday to Wednesday report week, as much of the country faced cold temperatures. The Henry Hub spot price dropped mid-week, but posted an overall 12¢ gain from $2.73 per million British thermal unit (MMBtu) on Wednesday, February 4, to $2.85/MMBtu on Wednesday, February 11.
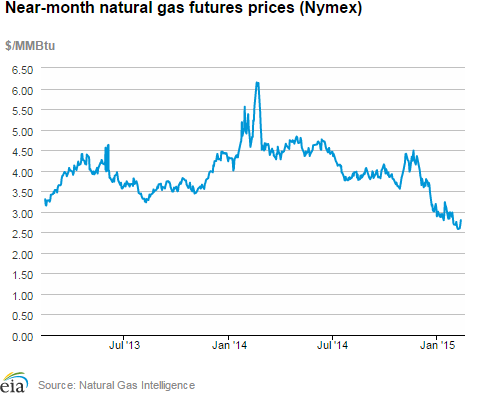
- At the New York Mercantile Exchange (Nymex), the price of the near-month (March 2015) contract rose from $2.662/MMBtu last Wednesday to $2.797/MMBtu yesterday.
- Working natural gas in storage decreased to 2,268 Bcf as of Friday, February 6, according to the U.S. Energy Information Administration (EIA) Weekly Natural Gas Storage Report (WNGSR). A net withdrawal from storage of 160 Bcf for the week resulted in storage levels 31.4% above year-ago levels and 0.5% below the five-year average for this week.
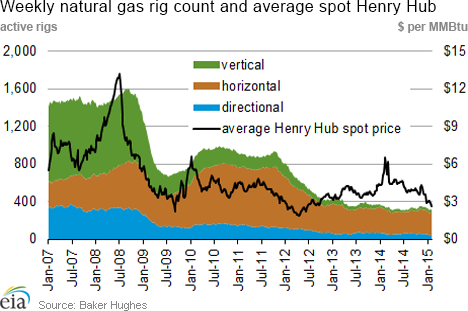
- The total U.S. rig count fell by 87 units to 1,456 active units for the week ending February 6, according to data reported by Baker Hughes Inc. The natural gas rig count fell by 5 units to 314, while the oil rig count fell by 83 units to 1,140. The largest decline occurred in the Permian Basin, where rigs fell by 37 units. One miscellaneous rig was placed into service.
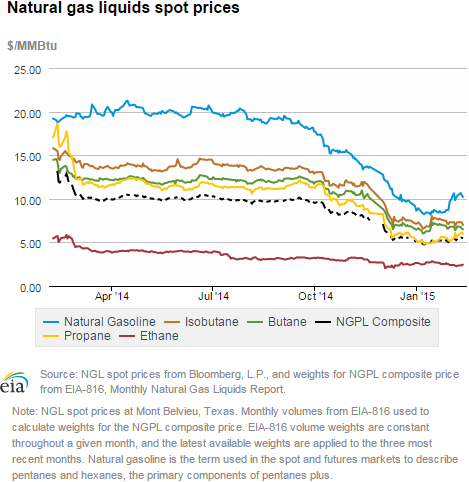
- The natural gas plant liquids composite price rose 21¢ for the week ending February 6, increasing by 4.2% from $5.15/MMBtu to $5.36/MMBtu from Friday to Friday. Mont Belvieu NGL spot prices were mixed this week, with natural gasoline and propane rising 15.8% and 6.4%, respectively, while ethane fell 7.5%, butane fell 1.3%, and isobutane fell 1.7%.
Prices/Demand/Supply:
Henry Hub falls to lowest price since June 2012. On Friday, February 6, heading into a warm weekend, the Henry Hub spot price settled at $2.55/MMBtu, its lowest level since June 22, 2012. Prices rose through the rest of the report week, to settle at $2.85/MMBtu, but are still relatively very low. Strong production and lower-than-average storage withdrawals this winter have led to this year's lower prices. In most other parts of the country, prices followed the same pattern, rising slightly over the report week but remaining relatively low. At the PG&E Citygate, which serves Northern California, the spot price rose from $2.93/MMBtu to $3.03/MMBtu. At Wyoming's Opal Hub in the Rockies, prices rose from $2.36/MMBtu to $2.59/MMBtu.
Northeast receives snow, price for Boston is at seasonal high. In the Northeast, where infrastructure constraints often lead to price spikes in times of high demand, prices at trading locations serving major market areas were mixed. At the Algonquin Citygate, which serves Boston consumers, prices began the week at $12.30/MMBtu before dropping to $8.65/MMBtu on Friday heading into the weekend. As temperatures cooled again, and New England received up to 2 feet of snow in some areas, prices began to rise. Algonquin Citygate prices ended this week at $19.27/MMBtu, their highest price of the winter season. Similarly, at Transcontinental Pipeline's Zone 6 trading point for delivery into New York City, prices began the week at $13.23/MMBtu, fell on Friday, and ended the report week at $15.22/MMBtu.
Marcellus-area prices rise. Marcellus-area prices also rose moderately this week, but for the most part still remain far below the rest of the country. At the Leidy Hub, which represents deliveries into several pipeline systems in the upper west-central portion of Pennsylvania, prices rose from $1.58/MMBtu last Wednesday to $1.70/MMBtu yesterday. Prices at Tennessee's Zone 4 trading region, which represents Marcellus deliveries on Tennessee's system, rose from $1.34/MMBtu last Wednesday to $1.61/MMBtu yesterday. Prices at Dominion South have been rising since the beginning of the year, and rose from $2.42/MMBtu last week to $2.83/MMBtu yesterday.
Demand falls overall. Domestic consumption fell 7.6% this report week, driven by declines in residential/commercial and electric power sectors. Despite some severe winter weather in the Northeast, U.S. residential consumption fell 8.9% week over week, and consumption of natural gas for electric power generation fell 8.9%. Industrial consumption fell 0.8%. Exports to Mexico rose 4.4% this week. Total consumption is 19.7% less than last year at this time.
Supply falls. Total natural gas supply fell 0.9% this week, driven by a 11.9% decline in imports from Canada. LNG sendout fell slightly. Domestic production remains strong, however, and dry production rose slightly from last week and is 13.1% greater than last year at this time.
Nymex prices rise. Near-month Nymex prices rose from $2.662/MMBtu last Wednesday to $2.797/MMBtu yesterday. The price of the 12-month strip (the average of the 12 contracts between March 2015 and February 2016) rose from $2.889/MMBtu last Wednesday to $3.014/MMBtu yesterday.
Storage
Storage inventories less than 1% below five-year average. The net withdrawal reported for the week ending February 6 was 160 Bcf, 18 Bcf lower than the five-year average net withdrawal for that week and 74 Bcf lower than last year's net withdrawal. Working gas inventories as of February 6 totaled 2,268 Bcf, 542 Bcf (31.4%) higher than last year at this time and 11 Bcf (0.5%) lower than the five-year (2010-14) average.
Storage withdrawals are lower than market expectations. Market expectations, on average, called for a pull of 168 Bcf. When the EIA storage report was released at 10:30 a.m. on February 12, the price for the March natural gas futures contract decreased 6¢, to $2.74/MMBtu, in trading on the Nymex. In the next hour, prices fell further, trading around $2.69/MMBtu.
Stocks in all three regions are above their year-ago levels. Storage levels for the East, West, and Producing regions were above their year-ago levels by 252 Bcf, 106 Bcf, and 118 Bcf, respectively, but the East and Producing regions remain below their five-year average levels. The West region is above its five-year average level by 38 Bcf. The East and Producing regions had net withdrawals of 113 Bcf (10 Bcf higher than its five-year average withdrawal) and 47 Bcf (7 Bcf lower), respectively. Inventories in the West remained flat, compared to their five-year average withdrawal of 21 Bcf.
Temperatures during the storage report week are cooler than normal. Temperatures in the Lower 48 states averaged 33.1° for the storage report week, 1.1° cooler than the 30-year normal temperature and 1.8° warmer than the temperatures during the same week last year. There were 224 population-weighted heating degree days during the storage report week, 29 more than the 5-year average and 15 fewer than during the same period last year.
See also:
| Spot Prices ($/MMBtu) | Thu, 05-Feb |
Fri, 06-Feb |
Mon, 09-Feb |
Tue, 10-Feb |
Wed, 11-Feb |
|---|---|---|---|---|---|
| Henry Hub |
2.63 |
2.55 |
2.60 |
2.63 |
2.85 |
| New York |
6.13 |
3.47 |
7.52 |
11.35 |
15.22 |
| Chicago |
2.62 |
2.59 |
2.63 |
2.76 |
3.14 |
| Cal. Comp. Avg,* |
2.49 |
2.38 |
2.54 |
2.58 |
2.79 |
| Futures ($/MMBtu) | |||||
| March contract |
2.600 |
2.579 |
2.597 |
2.677 |
2.797 |
| April contract |
2.614 |
2.602 |
2.625 |
2.704 |
2.814 |
| *Avg. of NGI's reported prices for: Malin, PG&E citygate, and Southern California Border Avg. | |||||
| Source: NGI's Daily Gas Price Index | |||||
| U.S. natural gas supply - Gas Week: (2/4/15 - 2/11/15) | ||
|---|---|---|
Percent change for week compared with: |
||
last year |
last week |
|
| Gross production | 13.22%
|
0.14%
|
| Dry production | 13.09%
|
0.14%
|
| Canadian imports | -14.89%
|
-11.91%
|
| West (net) | 3.52%
|
-5.90%
|
| Midwest (net) | -52.56%
|
-27.97%
|
| Northeast (net) | 19.47%
|
-6.66%
|
| LNG imports | 67.19%
|
-7.01%
|
| Total supply | 10.79%
|
-0.86%
|
| Source: BENTEK Energy LLC | ||
| U.S. consumption - Gas Week: (2/4/15 - 2/11/15) | ||
|---|---|---|
Percent change for week compared with: |
||
last year |
last week |
|
| U.S. consumption | -20.5%
|
-7.8%
|
| Power | -12.4%
|
-8.9%
|
| Industrial | -4.2%
|
-0.8%
|
| Residential/commercial | -29.4%
|
-10.6%
|
| Total demand | -19.7%
|
-7.6%
|
| Source: BENTEK Energy LLC | ||
| Rigs | |||
|---|---|---|---|
Fri, February 06, 2015 |
Change from |
||
last week |
last year |
||
| Oil rigs | 1,140 |
-6.79% |
-19.49% |
| Natural gas rigs | 314 |
-1.57% |
-10.54% |
| Miscellaneous | 2 |
100.00% |
-50.00% |
| Rig numbers by type | |||
|---|---|---|---|
Fri, February 06, 2015 |
Change from |
||
last week |
last year |
||
| Vertical | 233 |
-0.85% |
-40.10% |
| Horizontal | 1,088 |
-6.85% |
-7.48% |
| Directional | 135 |
-3.57% |
-34.47% |
| Source: Baker Hughes Inc. | |||
| Working gas in underground storage | ||||
|---|---|---|---|---|
Stocks billion cubic feet (bcf) |
||||
| Region | 2015-02-06 |
2015-01-30 |
change |
|
| East | 1,081 |
1,194 |
-113 |
|
| West | 371 |
371 |
0 |
|
| Producing | 816 |
863 |
-47 |
|
| Total | 2,268 |
2,428 |
-160 |
|
| Source: U.S. Energy Information Administration | ||||
| Working gas in underground storage | |||||
|---|---|---|---|---|---|
Historical comparisons |
|||||
Year ago (2/6/14) |
5-year average (2010-2014) |
||||
| Region | Stocks (Bcf) |
% change |
Stocks (Bcf) |
% change |
|
| East | 829 |
30.4 |
1,113 |
-2.9 |
|
| West | 265 |
40.0 |
333 |
11.4 |
|
| Producing | 632 |
29.1 |
833 |
-2.0 |
|
| Total | 1,726 |
31.4 |
2,279 |
-0.5 |
|
| Source: U.S. Energy Information Administration | |||||
| Temperature -- heating & cooling degree days (week ending Feb 05) | ||||||||
|---|---|---|---|---|---|---|---|---|
HDD deviation from: |
CDD deviation from: |
|||||||
| Region | HDD Current |
normal |
last year |
CDD Current |
normal |
last year |
||
| New England | 328
|
55
|
74
|
0
|
0
|
0
|
||
| Middle Atlantic | 300
|
40
|
38
|
0
|
0
|
0
|
||
| E N Central | 316
|
28
|
-6
|
0
|
0
|
0
|
||
| W N Central | 324
|
25
|
-43
|
0
|
0
|
0
|
||
| South Atlantic | 186
|
10
|
10
|
4
|
-3
|
-8
|
||
| E S Central | 190
|
12
|
3
|
0
|
0
|
0
|
||
| W S Central | 137
|
10
|
-14
|
0
|
-4
|
-1
|
||
| Mountain | 168
|
-51
|
-82
|
0
|
-1
|
0
|
||
| Pacific | 67
|
-44
|
-67
|
0
|
0
|
0
|
||
| United States | 224
|
8
|
-15
|
1
|
-1
|
-2
|
||
|
Note: HDD = heating degree-day; CDD = cooling degree-day Source: National Oceanic and Atmospheric Administration | ||||||||
Average temperature (°F)
7-Day Mean ending Feb 05, 2015
Source: NOAA/National Weather Service
Deviation between average and normal (°F)
7-Day Mean ending Feb 05, 2015
Source: NOAA/National Weather Service