In the News:
Record production, potential for continued storage injections precedes winter season
Record high natural gas production this year is helping to ensure that adequate supplies of natural gas are available, after ending last winter with the lowest storage inventories since 2003. The Energy Information Administration (EIA) forecasts that for a nation that uses natural gas to heat half its homes and generate a quarter of its electricity, there will be 3,532 billion cubic feet (Bcf) in storage by October 31.
But that's only part of the story.
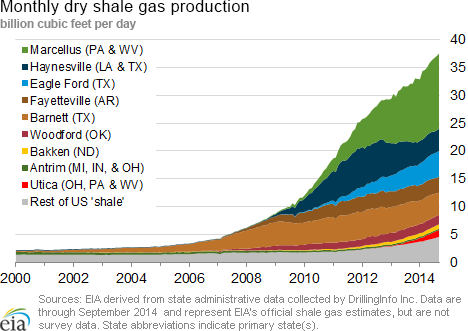
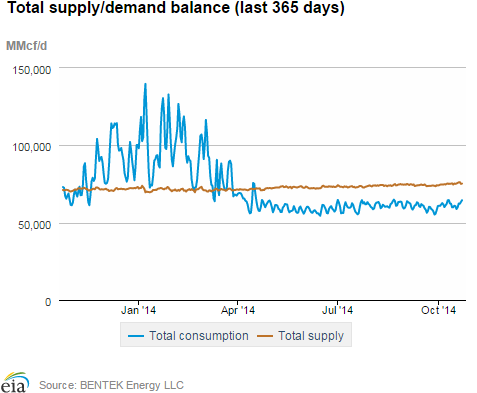
There has been robust gas production all year, with several production records being set in 2014. Bentek Energy reported new highs accomplished this past week—both a single-day record of 70.5 Bcf/d this past Sunday, and a new weekly record average of 69.7 Bcf/d. The month-to-date production average is now 69.7 Bcf/d, 5.2 Bcf/d higher than October 2013.
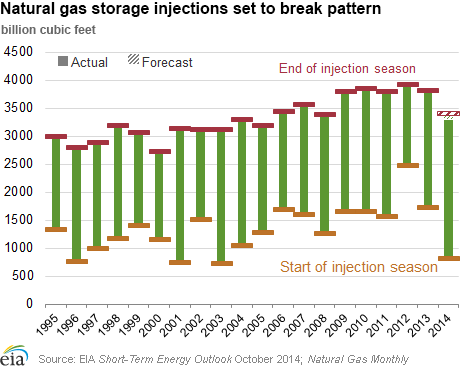
In conjunction with record production, injections are on course to be the largest seasonal refill on record. So far in the injection season (April through October), more than 2,570 Bcf has been placed into storage. EIA is forecasting that an additional 139 Bcf will be injected before the end of the traditional injection season (October 31), and for the past 11 years going back to the beginning of EIA's weekly surveys, injections have continued into November.
With storage levels at 336 Bcf behind this time last year, and record production levels, EIA forecasts that the gap could be narrowed by 139 Bcf by the end of October, and tightened even more as November draws to a close. Storage is largely driven by current-use demand. In the winter, when temperatures drop and demand rises, even with record production rates, storage inventories will decline.
The National Oceanic and Atmospheric Administration (NOAA) is predicting average to above average temperatures for the 2014-15 winter season in its U.S. Winter Outlook. NOAA is calling for warmer weather in the West and in New England, and cooler temperatures in parts of the south-central and southeastern United States.
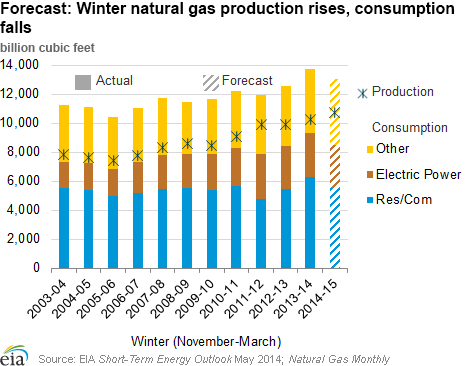
EIA forecasts that total natural gas consumption will average 86.5 Bcf/d this winter. This is 4.5 Bcf/d lower than last winter's average consumption of 91.0 Bcf/d. The reduction in consumption this winter comes from the residential and commercial sectors because of reduced space heating needs. EIA is forecasting an increase in demand for natural gas in the industrial sector through the winter.
In contrast to the overall decline in consumption this winter, EIA forecasts that natural gas production will increase to 71.4 Bcf/d, on average over this winter. This is an increase of 3.3 Bcf/d over last winter's 68.1 Bcf/d average.
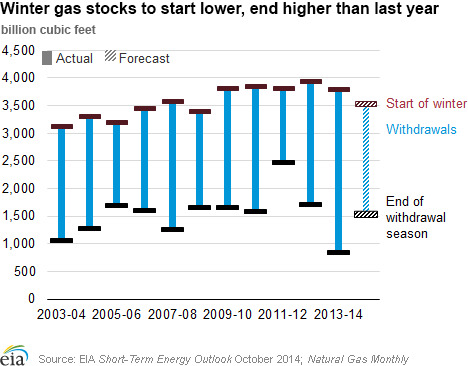
If that production differential materializes throughout the November-March winter, which is 151 days, the nation would have 500 Bcf more gas available for use than a year ago. Looked at another way, and coupled with EIA's forecast of having 3,532 Bcf in storage on October 31, that would be like having more than 4,000 Bcf in storage at the start of winter, or 145 Bcf more than the average peak pre-winter storage level over the past five years.
Higher levels of production combined with lower levels of consumption result in an anticipated drawdown of natural gas inventories of 1,998 Bcf, significantly less than last winter. EIA's forecast places end-of-March 2015 inventories at 1,534 Bcf, 122 Bcf below the five-year (2010-14) average, but well above the March 2014 endpoint of 857 Bcf.
Overview:
(For the Week Ending Wednesday, October 22, 2014)
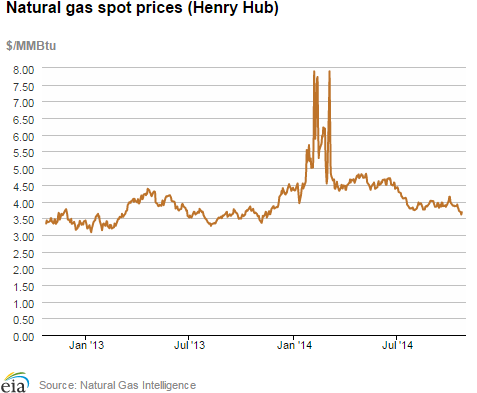
- Spot prices fluctuated over the report week (Wednesday to Wednesday), with Henry Hub starting the week at $3.82 per million British thermal units (MMBtu) on October 15, dropping 21 cents by Tuesday to $3.61, before settling at $3.68/MMBtu yesterday. Notably, northeastern pricing points remained relatively low; Algonquin Citygate, serving Boston, closed the report week at $2.74/MMBtu, and Transcontinental's Pipeline Zone 6 New York ended the report week at $2.68/MMBtu.
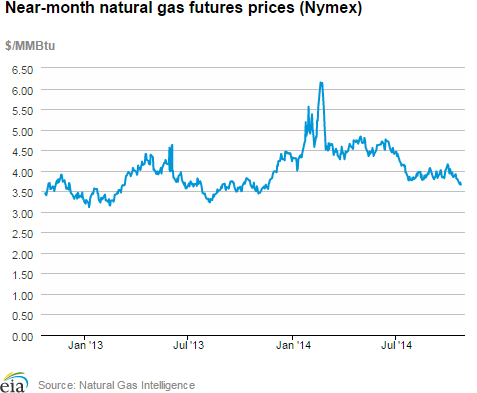
- The New York Mercantile Exchange (Nymex) near-month (November 2014) contract fell again this week from $3.802/MMBtu last Wednesday to $3.659/MMBtu yesterday. The 12-month strip followed the same trend, dropping from $3.806/MMBtu on October 15 to $3.693 on October 22.
- Working natural gas in storage rose to 3,393 Bcf as of Friday, October 17, according to the U.S. Energy Information Administration (EIA) Weekly Natural Gas Storage Report (WNGSR). A net increase in storage of 94 Bcf for the week resulted in storage levels 9.0% below year-ago levels and 9.1% below the five-year average for this week.
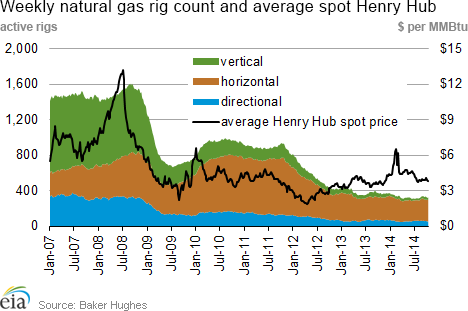
- The total rotary rig count as of October 17 was 1,918 units, a decrease of 12 from the previous week, according to data from Baker Hughes Inc. The oil rig count decreased by 19 units to 1,590. The natural gas rig count increased by 8 to 328 active units from the previous week.
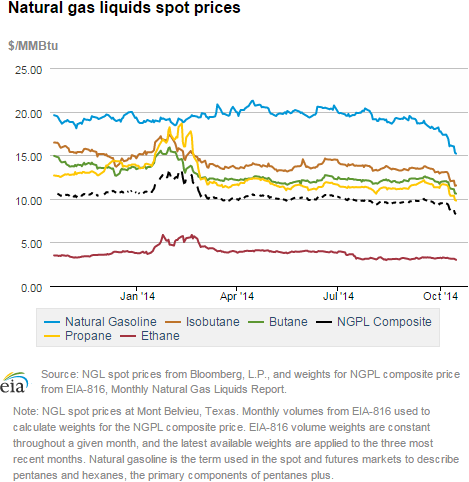
- The Mont Belvieu natural gas plant liquids composite price declined again this week, dropping 7.8%, or 72 cents, to $8.42/MMBtu for the week covering October 13 –17. All components of the price fell, with natural gasoline, ethane, propane, butane, and isobutane falling 7.3%, 3.7%, 9.7%, 7.7%, and 7.6%, respectively. Plant liquid prices continue to follow the decline in oil prices as they have over the past few weeks.
Prices/Demand/Supply:
Natural gas prices fluctuate modestly over the report week. With seasonal fall temperatures across most of the country, there were relatively small movements in spot prices during the report week. Prices at most locations fell by 5% or less over the report week. The Henry Hub spot price fell from $3.82/MMBtu last Wednesday to $3.68/MMBtu yesterday.
Prices in the Northeast remained below prices at the Henry Hub, and had more pronounced changes over the course of the report week. Spot prices at the Algonquin Citygate, serving Boston, fell 11%, from $3.08/MMBtu last Wednesday to $2.74/MMBtu yesterday. This might be attributable to milder temperatures that reduced the need for natural gas consumption in the electric power sector (power burn). According to data from Bentek, Northeast power burn declined by 13% from Wednesday to Wednesday. Prices at Transcontinental Pipeline Zone 6 (New York) increased 30% over the report week, but remain relatively low. After starting the report week at $2.06/MMBtu, prices at that location fell to $1.81/MMBtu on Friday and ended the report week at $2.68/MMBtu.
Marcellus prices post overall gains. After starting the week at $1.93/MMBtu and dropping to $1.80/MMBtu on Friday, Marcellus prices increased to close the report week at $2.22/MMBtu. Some industry trade press is attributing the higher price to the start of new processing capacity in Ohio and West Virginia.
Production tops 70 Bcf/d. Dry gas production hit a new single-day high of 70.5 Bcf/d on Sunday, as reported by Bentek. Overall dry production rose by 0.6%, driving an increase in overall supply of 0.5% for the report week.
U.S. natural gas imports from Canada fell by 0.3% over the report week. A 1.4% increase in Canadian natural gas imported into the western United States was more than offset by declines in imports of natural gas from Canada to the Midwest and Northeast of 6.9% and 87.4%, respectively. Milder weather this week in those regions likely contributed to the decline in imports. LNG sendout remained at minimal levels.
Demand decreases slightly. Consumption of natural gas for power generation fell 7.9%, causing a drop in total consumption of 0.6% week-over-week. Residential and commercial consumption increased 8.0% from the previous week, while industrial consumption rose 0.5%.
Nymex falls during the week. The near-month (November 2014) price fell from $3.800/MMBtu last Wednesday to $3.659/MMBtu yesterday. The price of the 12-month strip (the 12 contracts between November 2014 and October 2015) fell from $3.806/MMBtu to $3.693/MMBtu.
Storage
Net injection moves storage to within 9% of the 5-year average. The net injection reported for the week ending October 17 was 94 Bcf, 24 Bcf larger than the five-year average net injection of 70 Bcf and 8 Bcf larger than last year's net injection of 86 Bcf. Working gas inventories totaled 3,393 Bcf, 336 Bcf (9.0%) less than last year at this time and 338 Bcf (9.1%) below the five-year (2009-13) average.
Storage build is lower than expectations. Market expectations called for an average build of 98 Bcf. When the EIA storage report was released at 10:30 a.m., the price for the November natural gas futures contract rose 4 cents to $3.65/MMBtu in trading on the Nymex.
There currently are two more weeks in the injection season, which traditionally occurs April 1 through October 31, although in each of the past 11 years, injections continued into November. EIA forecasts that the end-of-October working natural gas inventory level will be 3,532 Bcf, which, as of October 7, would require an average injection of 70 Bcf per week through the end of October. EIA's forecast for the end-of-October inventory levels are below the five-year (2009-13) average peak storage value of 3,855 Bcf.
So far in the 2014 injection season, the United States has added a record 2,571 Bcf of natural gas to storage. This is significantly higher than the net storage injection of 2,029 over the same period last year, and 1,917 Bcf for these weeks between 2009 and 2013, on average. The average unit value of what storage holders put into storage from April 4 to October 17 was $4.24/MMBtu, 13% higher than the average value for the same 29 weeks last year of $3.76/MMBtu. The highest winter-month Nymex price (for the January 2015 contract) in trading for the week ending on October 17 averaged $4.00/MMBtu. This is 17 cents more than the current front month Nymex contract price for that week. A year ago, the difference was 24 cents/MMBtu.
All regions post larger-than-average builds. The East, West, and Producing regions had net injections of 47 Bcf (9 Bcf larger than its five-year average), 8 Bcf (1 Bcf larger than its five-year average), and 39 Bcf (12 Bcf larger than its five-year average), respectively. Storage levels for all three regions remain below their year-ago and five-year average levels.
Temperatures during the storage report week were a few degrees warmer than the 30-year average. Temperatures in the Lower 48 states averaged 60.6 degrees for the week, 2.7 degrees warmer than the 30-year normal temperature and 0.7 degree warmer than during the same period last year. There were 18 population-weighted cooling degree days during the storage report week, 5 more than the 30-year normal and 6 more than the same period last year. There were also 49 population-weighted heating degree days during the storage report week, 14 less than the 30-year normal and 1 more than the same period last year.
See also:

| Spot Prices ($/MMBtu) | Thu, 16-Oct |
Fri, 17-Oct |
Mon, 20-Oct |
Tue, 21-Oct |
Wed, 22-Oct |
|---|---|---|---|---|---|
| Henry Hub |
3.79 |
3.72 |
3.68 |
3.61 |
3.68 |
| New York |
2.06 |
1.81 |
2.37 |
2.62 |
2.68 |
| Chicago |
3.81 |
3.76 |
3.77 |
3.78 |
3.78 |
| Cal. Comp. Avg,* |
3.92 |
3.84 |
3.86 |
3.78 |
3.80 |
| Futures ($/MMBtu) | |||||
| November Contract |
3.796 |
3.766 |
3.670 |
3.711 |
3.659 |
| December Contract |
3.885 |
3.863 |
3.765 |
3.800 |
3.745 |
| *Avg. of NGI's reported prices for: Malin, PG&E citygate, and Southern California Border Avg. | |||||
| Source: NGI's Daily Gas Price Index | |||||
| U.S. Natural Gas Supply - Gas Week: (10/15/14 - 10/22/14) | ||
|---|---|---|
Percent change for week compared with: |
||
last year |
last week |
|
| Gross Production | 7.69%
|
0.57%
|
| Dry Production | 7.62%
|
0.56%
|
| Canadian Imports | 11.38%
|
-0.35%
|
| West (Net) | 12.82%
|
1.39%
|
| MidWest (Net) | 8.99%
|
-6.88%
|
| Northeast (Net) | -48.41%
|
-87.37%
|
| LNG Imports | -85.12%
|
20.62%
|
| Total Supply | 7.64%
|
0.50%
|
| Source: BENTEK Energy LLC | ||
| U.S. Consumption - Gas Week: (10/15/14 - 10/22/14) | ||
|---|---|---|
Percent change for week compared with: |
||
last year |
last week |
|
| U.S. Consumption | -3.1%
|
-0.6%
|
| Power | 2.6%
|
-7.9%
|
| Industrial | -1.1%
|
0.5%
|
| Residential/Commercial | -10.8%
|
8.0%
|
| Total Demand | -2.7%
|
-0.6%
|
| Source: BENTEK Energy LLC | ||
| Rigs | |||
|---|---|---|---|
Fri, October 17, 2014 |
Change from |
||
last week |
last year |
||
| Oil Rigs | 1,590 |
-1.18% |
16.83% |
| Natural Gas Rigs | 328 |
2.50% |
-11.83% |
| Miscellaneous | 0 |
-100.00% |
-100.00% |
| Rig Numbers by Type | |||
|---|---|---|---|
Fri, October 17, 2014 |
Change from |
||
last week |
last year |
||
| Vertical | 362 |
-2.16% |
-9.73% |
| Horizontal | 1,353 |
0.00% |
23.11% |
| Directional | 203 |
-1.93% |
-15.06% |
| Source: Baker Hughes Inc. | |||
| Working Gas in Underground Storage | ||||
|---|---|---|---|---|
Stocks billion cubic feet (bcf) |
||||
| Region | 2014-10-17 |
2014-10-10 |
change |
|
| East | 1,872 |
1,825 |
47 |
|
| West | 482 |
474 |
8 |
|
| Producing | 1,039 |
1,000 |
39 |
|
| Total | 3,393 |
3,299 |
94 |
|
| Source: U.S. Energy Information Administration | ||||
| Working Gas in Underground Storage | |||||
|---|---|---|---|---|---|
Historical Comparisons |
|||||
Year ago (10/17/13) |
5-year average (2009-2013) |
||||
| Region | Stocks (Bcf) |
% change |
Stocks (Bcf) |
% change |
|
| East | 1,940 |
-3.5 |
2,014 |
-7.1 |
|
| West | 548 |
-12.0 |
518 |
-6.9 |
|
| Producing | 1,240 |
-16.2 |
1,200 |
-13.4 |
|
| Total | 3,729 |
-9.0 |
3,731 |
-9.1 |
|
| Source: U.S. Energy Information Administration | |||||
| Temperature -- Heating & Cooling Degree Days (week ending Oct 16) | ||||||||
|---|---|---|---|---|---|---|---|---|
HDD deviation from: |
CDD deviation from: |
|||||||
| Region | HDD Current |
normal |
last year |
CDD Current |
normal |
last year |
||
| New England | 70
|
-25
|
-7
|
5
|
5
|
5
|
||
| Middle Atlantic | 56
|
-28
|
8
|
4
|
3
|
4
|
||
| E N Central | 81
|
-7
|
19
|
1
|
-1
|
1
|
||
| W N Central | 94
|
8
|
17
|
0
|
-3
|
0
|
||
| South Atlantic | 23
|
-22
|
-1
|
42
|
13
|
16
|
||
| E S Central | 25
|
-18
|
10
|
21
|
8
|
5
|
||
| W S Central | 16
|
2
|
7
|
39
|
6
|
-10
|
||
| Mountain | 63
|
-20
|
-39
|
15
|
2
|
10
|
||
| Pacific | 10
|
-20
|
-22
|
15
|
6
|
14
|
||
| United States | 49
|
-14
|
1
|
18
|
5
|
6
|
||
|
Note: HDD = heating degree-day; CDD = cooling degree-day Source: National Oceanic and Atmospheric Administration | ||||||||
Average temperature (°F)
7-Day Mean ending Oct 16, 2014
Source: NOAA/National Weather Service
Deviation between average and normal (°F)
7-Day Mean ending Oct 16, 2014
Source: NOAA/National Weather Service