In the News:
Growth of natural gas design storage capacity slows in 2014
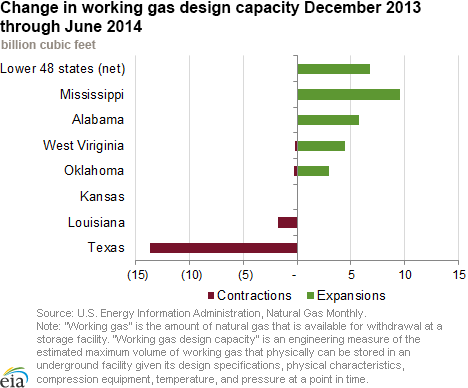
In the first six months of 2014, net working natural gas design storage capacity in the Lower 48 states grew nearly 7 billion cubic feet (Bcf), to 4,688 Bcf, according to data released by the U.S. Energy Information Administration (EIA) last Friday. This growth is lower than the net capacity additions in the first six months of 2013, when 25 Bcf of new capacity came online. All of the growth in 2014 came from expansions of existing facilities, and largely occurred at salt dome storage facilities in the Producing region.
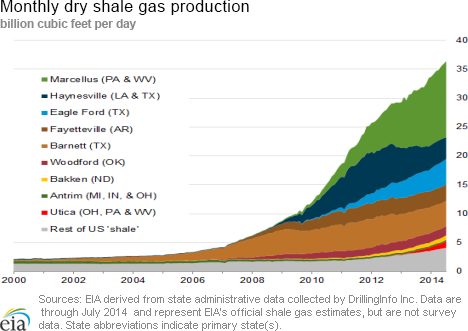
The subdued growth comes at a time when volumes of stored natural gas are running 15% below their year-ago and five-year-average volumes. At the same time, however, natural gas production is well ahead of the year-ago pace, with EIA reporting gross withdrawals from wells in June up 6.8% year-over-year.
Expansions at salt facilities in Mississippi and Alabama, totaling 15 Bcf, accounted for two-thirds of the capacity additions. The largest of these expansions occurred at the Mississippi Hub salt dome in Mississippi, when the facility’s third storage cavern came online in May, increasing the facility’s storage capacity by 8.3 Bcf. The second largest capacity expansion occurred with the June completion of the fifth cavern of Bay Gas Storage’s McIntosh salt dome in Alabama, which added 5.8 Bcf to working gas capacity.
On the other hand, the Bammel storage facility in Texas reduced its working gas capacity by nearly 12 Bcf, and two salt facilities in Louisiana (Egan and Boardwalk Storage) had a combined working gas capacity reduction of close to 2 Bcf.
Expansions and contractions of storage capacity can occur for several reasons. In addition to new facilities, capacities can change because of engineering studies and other periodic assessments that evaluate the amount of gas that is needed to maintain adequate pressure at a storage facility in order for it to operate efficiently and safely (this volume of gas is typically referred to as base or cushion gas).
There are several planned storage projects scheduled to come online over the next couple of years that could add 54 Bcf of working gas capacity. Four of these are new facilities that are currently under construction. A new depleted reservoir facility, located in Colorado, with a planned completion date late in 2014, will increase working gas capacity by 7 Bcf. Additionally, three new salt dome facilities, which are scheduled to enter service in 2015 and 2016 in Louisiana and Texas, could provide an additional 29 Bcf of working gas capacity.
There also are two salt facility expansions in Louisiana and Texas that are slated for completion in 2014; these could add up to 18 Bcf of new working gas capacity. EIA employs two measures of storage capacity: demonstrated maximum capacity and design capacity. Demonstrated maximum working gas volume is a practical measure of how much gas can be stored for later use. This measure is calculated as the sum of peak working gas levels at all facilities, regardless of when the individual peaks occurred over a five-year period, and is the more conservative of these measures.
EIA reported in February that the demonstrated peak capacity for the Lower 48 states grew 68 Bcf to 4,332 Bcf by November 2013 from November 2012. This is the industry-established practical measure of full storage. Demonstrated peak capacity is 92% of design capacity, and the volume of gas in storage as reported by EIA earlier today shows inventories at 63% full.
EIA began reporting monthly field-level data for natural gas storage facilities in January 2014. Annual and monthly design capacity information for all facilities, including inactive fields, is available in the Natural Gas Annual Respondent Query System. EIA began reporting weekly natural gas storage injections and withdrawals in 2002.
Overview:
(For the Week Ending Wednesday, September 3, 2014)
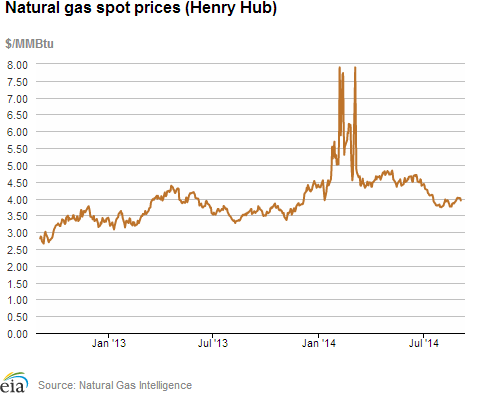
- Spot prices fell at most trading locations across the country for this report week (Wednesday, August 27, to Wednesday, September 3). The Henry Hub spot price fell from $3.99 per million British thermal unit (MMBtu) last Wednesday to $3.94/MMBtu yesterday.
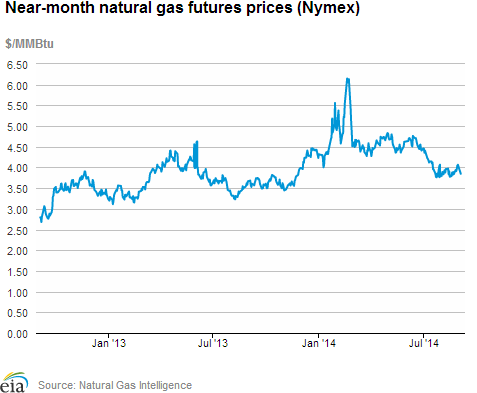
- At the New York Mercantile Exchange (Nymex), the near-month (October 2014) contract fell from $4.003/MMBtu last Wednesday to $3.847/MMBtu yesterday.
- Working natural gas in storage rose to 2,709 Bcf as of Friday, August 29, according to the U.S. Energy Information Administration (EIA) Weekly Natural Gas Storage Report (WNGSR). A net increase in storage of 79 billion cubic feet (Bcf) for the week resulted in storage levels 14.8% below year-ago levels and 15.4% below the five-year average for this week.
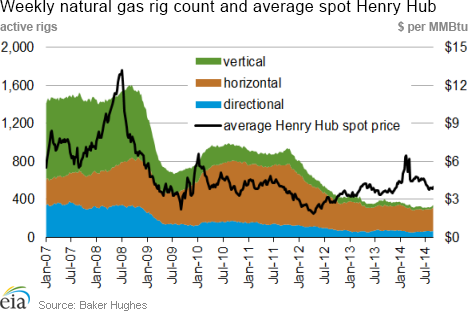
- The total U.S. rig count rose by 18 units to 1,914 as of August 29, according to Baker Hughes Inc. The natural gas rig count rose by 8 to 338 and the oil rig count rose by 11 to 1,575. Natural gas rigs are 42 units below year-ago levels, while oil rig counts are 187 units greater than their levels last year.
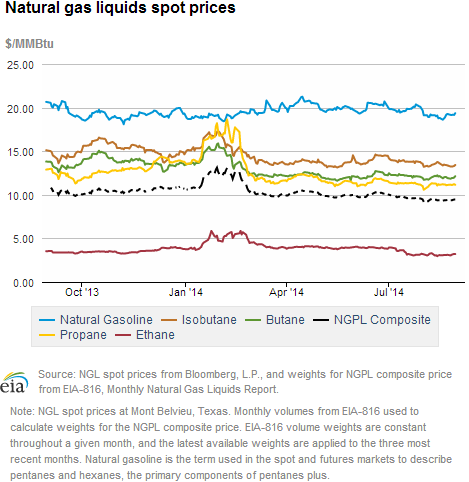
- The Mont Belvieu natural gas plant liquids composite price rose 0.5% to $9.41/MMBtu for the week covering August 25 — August 29. The ethane price rose 2.1%, while the prices of natural gasoline, propane, butane, and isobutane were mixed, with natural gasoline rising 1.4%, propane remaining level, and butane and isobutane falling 0.1%, and 0.8%, respectively.
Prices/Demand/Supply:
Natural gas prices fell over the week. Natural gas prices moved downward at most market locations over the week. The Henry Hub spot price dropped from $3.99/MMBtu last week to $3.94/MMBtu yesterday. Major locations outside of the Northeast also had lower prices through the week. The Chicago Citygate, for example, fell from $4.01/MMBtu last Wednesday to $3.92/MMBtu yesterday, while the PG&E Citygate in Northern California fell from $4.56/MMBtu last Wednesday to $4.38/MMBtu yesterday.
Warm weather boosts Northeast prices. Major Northeast market prices, which have traded at a strong discount to the Henry Hub since the spring, exceeded the Henry Hub by the end of the report week. At Transcontinental Pipeline's Zone 6 (Transco Z6) delivery point, which serves New York City, prices began the week at $2.79/MMBtu, but increased toward the end of the report week as warmer temperatures settled in the area. Prices at Transco Z6 ended the report week at $3.11/MMBtu. Similarly, at the Algonquin Citygate, which serves Boston, prices started the report week last Wednesday at $2.92/MMBtu, but then moved up through the week to close at $4.32/MMBtu yesterday.
Marcellus prices remain low. Prices in the Marcellus Shale region remained low compared to most markets. At Tennessee Pipeline's Zone 4 Marcellus trading point, located in northeast Pennsylvania, prices fell from $2.16 on Wednesday to $1.95 on Thursday, but rebounded to end the report week at $2.40/MMBtu.
Nymex decreases this week. The price of the October 2014 natural gas futures contract settled at $4.003/MMBtu last Wednesday and then traded down to $3.847/MMBtu.
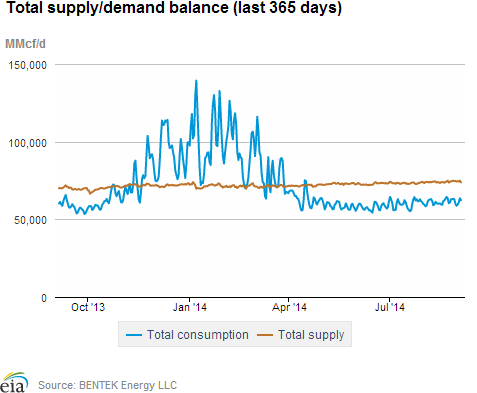
Supply flat this week. Although dry production rose 0.1% week-over-week, according to data from Bentek Energy, overall supply remained flat. Pipeline imports from Canada declined 1.0%, with a 5.7% increase in the West, offset by falling imports in the Midwest and Northeast. LNG imports remain at minimal levels.
Power burn decline drives reduced overall consumption. Natural gas used for power generation (power burn) fell 7.1% this week, with decreased power burn occurring in all areas except the Northeast. Industrial consumption rose 0.6%, residential/commercial consumption rose 1.9%, and exports to Mexico increased by 19.6%.
Storage
Net injections into storage higher than average. The net injection reported for the week ending August 29 was 79 Bcf, 23 Bcf larger than the five-year average net injection of 56 Bcf and 19 Bcf larger than last year's net injection of 60 Bcf. Working gas inventories totaled 2,709 Bcf, 471 Bcf (14.8%) less than last year at this time and 495 Bcf (15.4%) below the five-year (2009-13) average.
Storage build is larger than market expectations. Market expectations called for a build of 74 Bcf. When the EIA storage report was released at 10:30 a.m., the price for the September natural gas futures contract fell 6 cents to $3.81/MMBtu on the Nymex.
From the week ending on April 4 through the week ending on August 29, net storage injections totaled 1,887 Bcf versus 1,480 Bcf for the same 22 weeks in 2013, and 1,390 Bcf for these weeks between 2009 and 2013, on average. The average unit value of what storage holders put into storage from April 4 to August 29 was $4.36/MMBtu, 15% higher than the average value for the same 22 weeks last year of $3.81/MMBtu. The highest winter-month Nymex price (for the January 2015 contract) in trading for the week ending on August 29 averaged $4.21/MMBtu. This is 27 cents more than the current front month Nymex contract price for that week. A year ago, the difference was 40 cents/MMBtu, providing a bit more financial incentive to buy and store gas in the summer for sale in the winter.
There are currently 9 more weeks in the injection season, which traditionally occurs April 1 through October 31, although in many years injections continue into November. EIA forecasts that the end-of-October working natural gas inventory level will be 3,463 Bcf, which, as of August 12, would require an average injection of 84 Bcf per week through the end of October. EIA's forecast for the end-of-October inventory levels are below the five-year (2009-13) average peak storage value of 3,851 Bcf. To reach the five-year average peak value, average weekly injections through the end of October would need to be 127 Bcf.
All three regions post larger-than-average builds. The East, West, and Producing regions had net injections of 59 Bcf (11 Bcf larger than its five-year average), 10 Bcf (8 Bcf larger than its five-year average), and 10 Bcf (4 Bcf larger than its five-year average), respectively. Storage levels for all three regions remain below their year-ago and 5-year average levels.
Temperatures during the storage report week were a few degrees warmer than the 30-year average. Temperatures in the Lower 48 states averaged 75.0 degrees for the week, 2.6 degrees warmer than the 30-year normal temperature and 0.1 degrees cooler than during the same period last year. There were 72 population-weighted cooling degree days during the storage report week, 14 cooling degree days higher than the 30-year normal, but similar to the same period last year.
See also:
| Spot Prices ($/MMBtu) | Thu, 28-Aug |
Fri, 29-Aug |
Mon, 1-Sep |
Tue, 2-Sep |
Wed, 3-Sep |
|---|---|---|---|---|---|
| Henry Hub |
4.02 |
4.02 |
Holiday |
4.04 |
3.94 |
| New York | 1.96 |
2.48 |
Holiday |
3.08 |
3.11 |
| Chicago | 4.01 |
4.02 |
Holiday |
4.00 |
3.92 |
| Cal. Comp. Avg,* |
4.23 |
4.22 |
Holiday |
4.16 |
4.11 |
| Futures ($/MMBtu) | |||||
| October Contract | 4.044 |
4.065 |
Holiday |
3.890 |
3.847 |
| November Contract | 4.101 |
4.116 |
Holiday |
3.938 |
3.894 |
| *Avg. of NGI's reported prices for: Malin, PG&E citygate, and Southern California Border Avg. | |||||
| Source: NGI's Daily Gas Price Index | |||||
| U.S. Natural Gas Supply - Gas Week: (8/27/14 - 9/3/14) | ||
|---|---|---|
Percent change for week compared with: |
||
last year |
last week |
|
| Gross Production | 5.79%
|
0.12%
|
| Dry Production | 5.73%
|
0.12%
|
| Canadian Imports | -0.59%
|
-0.99%
|
| West (Net) | -16.24%
|
5.69%
|
| MidWest (Net) | 28.89%
|
-10.91%
|
| Northeast (Net) | -191.50%
|
-71.00%
|
| LNG Imports | -76.66%
|
-2.66%
|
| Total Supply | 4.80%
|
0.04%
|
| Source: BENTEK Energy LLC | ||
| U.S. Consumption - Gas Week: (8/27/14 - 9/3/14) | ||
|---|---|---|
Percent change for week compared with: |
||
last year |
last week |
|
| U.S. Consumption | -1.3%
|
-3.1%
|
| Power | -6.4%
|
-7.1%
|
| Industrial | 1.3%
|
0.6%
|
| Residential/Commercial | 9.4%
|
1.9%
|
| Total Demand | -0.7%
|
-2.4%
|
| Source: BENTEK Energy LLC | ||
| Rigs | |||
|---|---|---|---|
Fri, August 29, 2014 |
Change from |
||
last week |
last year |
||
| Oil Rigs | 1,575 |
0.70% |
13.47% |
| Natural Gas Rigs | 338 |
2.42% |
-11.05% |
| Miscellaneous | 1 |
-50.00% |
-87.50% |
| Rig Numbers by Type | |||
|---|---|---|---|
Fri, August 29, 2014 |
Change from |
||
last week |
last year |
||
| Vertical | 374 |
2.19% |
-16.89% |
| Horizontal | 1,330 |
0.68% |
23.38% |
| Directional | 210 |
0.48% |
-15.32% |
| Source: Baker Hughes Inc. | |||
| Working Gas in Underground Storage | ||||
|---|---|---|---|---|
Stocks billion cubic feet (bcf) |
||||
| Region | 2014-08-29 |
2014-08-22 |
change |
|
| East | 1,462 |
1,403 |
59 |
|
| West | 426 |
416 |
10 |
|
| Producing | 821 |
811 |
10 |
|
| Total | 2,709 |
2,630 |
79 |
|
| Source: U.S. Energy Information Administration | ||||
| Working Gas in Underground Storage | |||||
|---|---|---|---|---|---|
Historical Comparisons |
|||||
Year ago (8/29/13) |
5-year average (2009-2013) |
||||
| Region | Stocks (Bcf) |
% change |
Stocks (Bcf) |
% change |
|
| East | 1,592 |
-8.2 |
1,690 |
-13.5 |
|
| West | 505 |
-15.6 |
472 |
-9.7 |
|
| Producing | 1,083 |
-24.2 |
1,042 |
-21.2 |
|
| Total | 3,180 |
-14.8 |
3,204 |
-15.4 |
|
| Source: U.S. Energy Information Administration | |||||
| Temperature -- Heating & Cooling Degree Days (week ending Aug 28) | ||||||||
|---|---|---|---|---|---|---|---|---|
HDD deviation from: |
CDD deviation from: |
|||||||
| Region | HDD Current |
normal |
last year |
CDD Current |
normal |
last year |
||
| New England | 3
|
-3
|
2
|
28
|
4
|
-12
|
||
| Middle Atlantic | 2
|
-2
|
1
|
39
|
2
|
-8
|
||
| E N Central | 2
|
-6
|
1
|
66
|
30
|
5
|
||
| W N Central | 4
|
-6
|
4
|
77
|
28
|
-12
|
||
| South Atlantic | 0
|
-1
|
0
|
89
|
6
|
7
|
||
| E S Central | 0
|
-1
|
0
|
106
|
28
|
23
|
||
| W S Central | 0
|
0
|
0
|
138
|
25
|
16
|
||
| Mountain | 8
|
-4
|
8
|
49
|
-14
|
-25
|
||
| Pacific | 0
|
-5
|
0
|
49
|
8
|
-6
|
||
| United States | 2
|
-4
|
1
|
72
|
14
|
0
|
||
|
Note: HDD = heating degree-day; CDD = cooling degree-day Source: National Oceanic and Atmospheric Administration | ||||||||
Average temperature (°F)
7-Day Mean ending Aug 28, 2014
Source: NOAA/National Weather Service
Deviation between average and normal (°F)
7-Day Mean ending Aug 28, 2014
Source: NOAA/National Weather Service