In the News:
Price volatility falls to prewinter levels as storage injection season nears
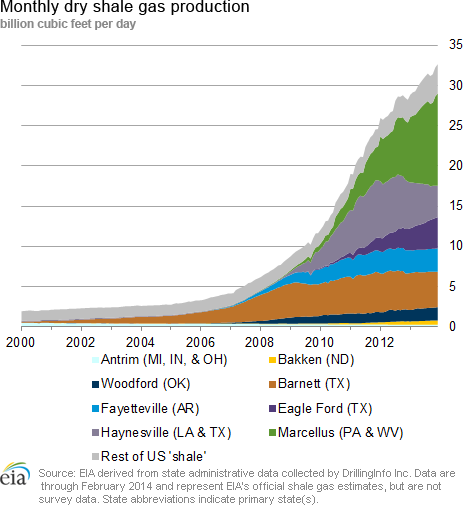
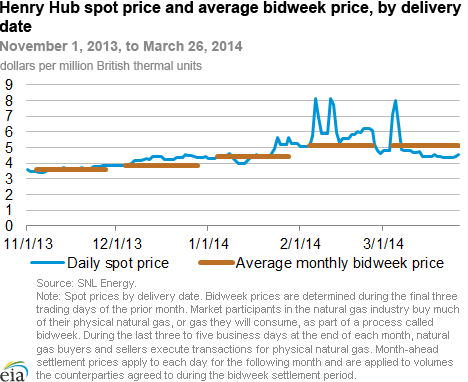
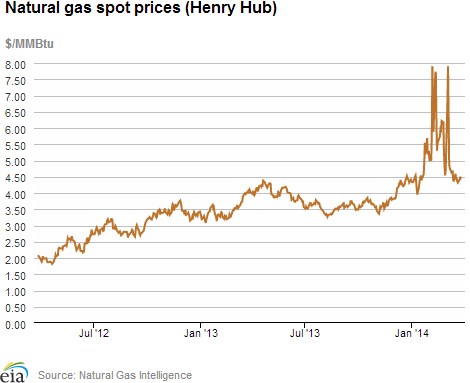
Natural gas markets entered January 2014 with low storage levels, following heavy withdrawals at the end of 2013. In January 2014, Lower 48 working inventories fell to a 10-year low, as freezing temperatures led to record natural gas demand and storage withdrawals. Significant inventory drawdowns continued into February 2014, further tightening the balance between natural gas supply and demand and leading to increased natural gas spot price volatility, before relatively less severe temperatures in March brought spot price volatility back to prewinter levels.
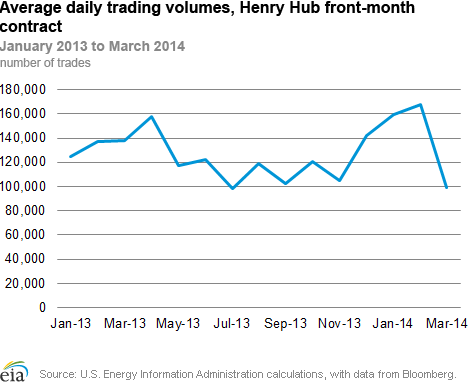
The Henry Hub natural gas spot price spiked on many days in January and February. As the winter progressed, increased spot price volatility led to increased interest in monthly delivery contracts, which provide a measure of protection against daily price fluctuations. This was particularly the case during the final three days of trading (bidweek) for the February 2014 Henry Hub natural gas delivery contract on the New York Mercantile Exchange (Nymex), from January 27 to January 29. During these three days, the February contract averaged $5.15 per million British thermal units (MMBtu). This was 74 cents/MMBtu higher than the average bidweek price for the January 2014 delivery contract, the largest increase between the January and February contracts since 2007. However, continued cold weather pushed the average spot price in February to $5.91/MMBtu. This was the largest difference between an average monthly spot price and the bidweek price for that month's delivery contract since December 2009, indicating that futures markets did not fully anticipate February's high prices.
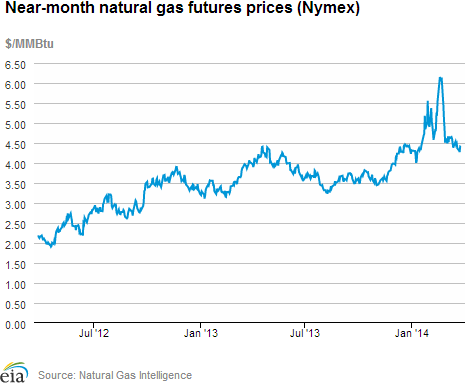
Markets continued to factor cold temperatures and a tightening supply-demand balance into price expectations for the March 2013 futures contract. The March contract traded at more than $6.00/MMBtu from February 19 to February 21, before dropping to $4.86/MMBtu when it settled on February 26. As cold weather moderated at the end of February, demand for firm gas delivery in March fell significantly.
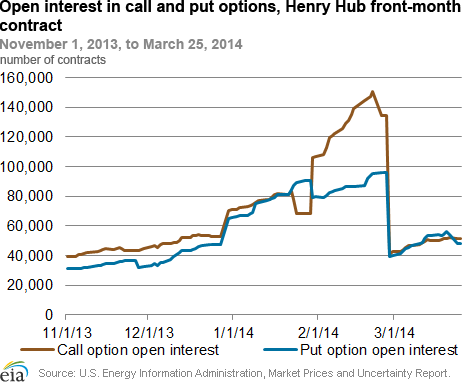
Producers and consumers also sought protection from price swings this winter through option contracts. Option contracts can serve as price protection by giving the buyer the right, but not the obligation, to buy (call option) or sell (put option) the underlying Henry Hub monthly delivery contract at a specified price. As with the futures market, activity in options markets increased in January and February, and then waned as cold weather moderated in March.
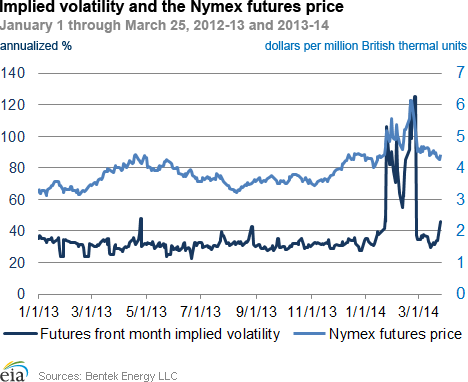
One useful instrument for gauging market uncertainty is implied volatility, a measure of the expected price variation of a financial instrument. In this case, the implied volatility measures the magnitude of expected price variations in the front-month futures contract. It is derived from the prices of call and put option contracts. As cold weather and depleted inventories increased price uncertainty, implied volatility hit its winter peak in late February. It then fell by more than two-thirds through this month as demand moderated with less severely cold temperatures.
Overview:
(For the Week Ending Wednesday, March 26, 2014)
- Spot prices rose modestly at most market locations during the report week (Wednesday, March 19, to Wednesday, March 26) as temperatures cooled over the weekend and led to increased natural gas demand. However, the Henry Hub spot price decreased by 2 cents/MMBtu. At the Nymex, the April 2014 contract decreased for the second week in a row, from $4.484/MMBtu on Wednesday, March 19, to $4.402/MMBtu yesterday.
- Working natural gas in storage fell to 896 billion cubic feet (Bcf) as of Friday, March 21, according to the U.S. Energy Information Administration (EIA) Weekly Natural Gas Storage Report (WNGSR). A net storage withdrawal of 57 Bcf for the week resulted in storage levels 50.1% below year-ago levels and 50.8% below the 5-year average.
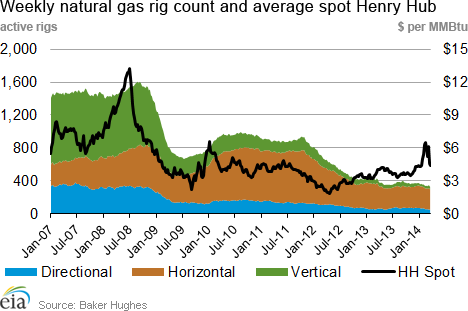
- The total rig count was 1,803 as of March 21, according to data from Baker Hughes Inc. The natural gas rotary rig count totaled 326, which represents a decrease of 18 rigs from the previous week, following a drop of 14 rigs in the Eagle Ford shale play in South Texas. The 326 rigs reflect a decrease of 92 units from the same time last year. Oil rigs rose for the sixth week in a row, by 12 units to 1,473, including an increase of 9 rigs in the Eagle Ford. The 1,473 rig U.S. total is 149 greater than last year at this time.
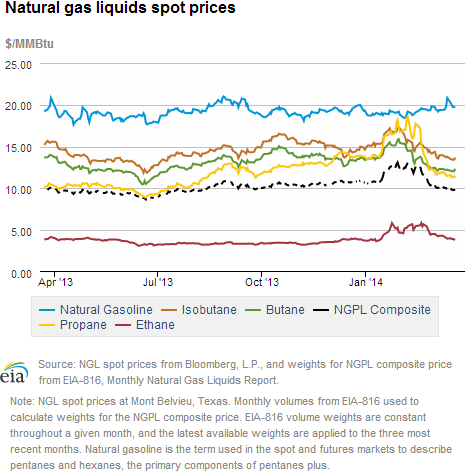
- The weekly average natural gas plant liquids composite price decreased for the seventh week in a row this week (covering March 17 through March 21), by 2.2%, and is now at $9.85/MMBtu. This is $2.84/MMBtu less than at the end of January, when the composite price was $12.69/MMBtu. The price of ethane decreased for the fourth week in a row, by 5.5%, while the price of propane decreased for the sixth week in a row, by 2.8%. Butane and isobutane prices declined by 1.0% and 2.4%, respectively, and natural gasoline prices rose 0.4%.
Prices/Demand/Supply:
Henry Hub price decreases. The Henry Hub spot price rose from $4.44/MMBtu last Wednesday to $4.50/MMBtu on Tuesday, but then fell yesterday to $4.42/MMBtu, in anticipation of today's warmer temperatures. The spot price climbed through Tuesday as temperatures cooled from 50 degrees Fahrenheit over the weekend to an average of 41 degrees from Monday, March 24, through yesterday. However, the average Lower 48 temperature climbed to 48 degrees today.
Northeast prices drop yesterday, following significant increases through Tuesday. Spot prices increased moderately through Tuesday at most major trading hubs, except in the Northeast, where they increased significantly. In Boston, the average daily temperature reached 43 degrees on Saturday, but declined to 29 degrees yesterday. The natural gas spot price at the Algonquin Citygate hub serving Boston area consumers rose from $5.36/MMBtu last Wednesday to $14.76/MMBtu on Tuesday, but then dropped to $7.08/MMBtu yesterday. In New York, the average daily temperature reached 49 degrees on Saturday, but decreased through yesterday to 34 degrees. The Transco Zone 6-New York spot price rose from $4.45/MMBtu last Wednesday to $9.01/MMBtu on Tuesday, but then dropped to $4.57/MMBtu yesterday. Temperatures in both Boston and New York rebounded significantly today.
Nymex prices decrease slightly. The Nymex near-month (April 2014) contract settled at $4.484/MMBtu last Wednesday, and settled yesterday at $4.402/MMBtu, a decrease of 8.2 cents/MMBtu. The April contract decreased by 11.5 cents/MMBtu last Thursday, before increasing slightly through trading yesterday. The 12-month strip (the 12 contracts between April 2014 and March 2015) fell by 5.7 cents/MMBtu, from $4.559/MMBtu last Wednesday to $4.502/MMBtu yesterday.
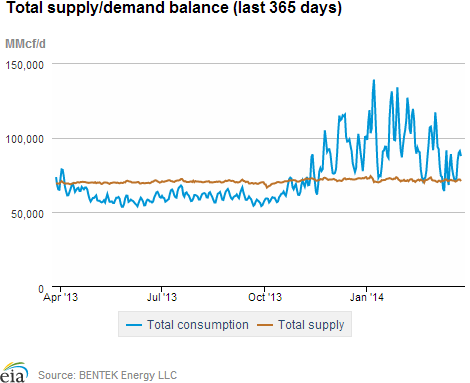
Consumption increases week over week. Average natural gas consumption increased for the second week in a row, by 1.9%, to 81.4 Bcf/d. Increases occurred in all sectors except industrial. Despite seasonal, spring-like temperatures last Friday, which lowered total natural gas consumption to 71.6 Bcf on that day, the return of cooler temperatures over the weekend led to increased total U.S. consumption, which reached 87.6 Bcf yesterday. Overall, residential and commercial consumption rose 1.4% this week. Consumption of natural gas for power generation increased by 5.5% over last week, rising in every region except Texas. Net natural gas exports to Mexico increased by 6.8%, while average industrial consumption decreased by 0.3%.
Decreased U.S. net imports push down total supply. Total supply decreased 0.2% this week, according to data from Bentek Energy. Natural gas dry production in the United States increased for the third week in a row, by 0.4%, to 66.9 Bcf/d. However, the 0.2 Bcf/d increase in U.S. dry production this week only partially offset a 0.3 Bcf/d (6.2%) decrease in net natural gas pipeline imports from Canada. Net natural gas pipeline imports from Canada into the midwestern United States increased by 0.2 Bcf/d (14.7%), but decreased by a combined 0.5 Bcf/d into the western United States (0.2 Bcf/d, 9.4%) and northeastern United States (0.3 Bcf/d, 26.5%). Net imports of Canadian gas into the West and Northeast decreased most significantly through Saturday, when warm temperatures led to lower demand.
Storage
Cooler weather brings a larger-than-average net withdrawal. The net withdrawal reported for the week ending March 21 was 57 Bcf, 50 Bcf larger than the 5-year average of 7 Bcf, but 33 Bcf smaller than last year's net withdrawal of 90 Bcf. Working gas inventories totaled 896 Bcf, 899 Bcf (50.1%) less than last year at this time, 926 Bcf (50.8%) below the 5-year (2009-13) average, and 721 Bcf (44.6%) below the 5-year minimum.
Storage draw larger than market expectations of 53 Bcf. When the EIA storage report was released at 10:30 a.m., the price for the April natural gas futures contract rose 4 cents to $4.47 /MMBtu on the Nymex. Prices remained at that level in the hour following the release.
All three regions posted larger-than-average withdrawal. The East, West, and Producing regions had net withdrawals of 39 Bcf (20 Bcf larger than its 5-year average withdrawal of 19 Bcf), 3 Bcf (compared with its 5-year average level showing no change for the week), and 15 Bcf (compared with its 5-year average injection of 12 Bcf), respectively. Storage levels for all three regions remain below their year-ago and 5-year average levels, and their 5-year minimums.
Temperatures during the storage report week cooler than normal. Temperatures in the Lower 48 states averaged 43.1 degrees for the week, 1.7 degrees cooler than the 30-year normal temperature, but 0.3 degree warmer than during the same period last year.
See also:
| Spot Prices ($/MMBtu) | Thu, 20-Mar |
Fri, 21-Mar |
Mon, 24-Mar |
Tue, 25-Mar |
Wed, 26-Mar |
|---|---|---|---|---|---|
| Henry Hub |
4.36 |
4.32 |
4.41 |
4.50 |
4.42 |
| New York |
4.34 |
4.68 |
7.18 |
9.01 |
4.57 |
| Chicago |
4.59 |
4.88 |
5.06 |
5.17 |
4.69 |
| Cal. Comp. Avg,* |
4.65 |
4.63 |
4.69 |
4.92 |
4.79 |
| Futures ($/MMBtu) | |||||
| April Contract |
4.369 |
4.313 |
4.276 |
4.411 |
4.402 |
| May Contract |
4.349 |
4.297 |
4.272 |
4.414 |
4.395 |
| *Avg. of NGI's reported prices for: Malin, PG&E citygate, and Southern California Border Avg. | |||||
| Source: NGI's Daily Gas Price Index | |||||
| U.S. Natural Gas Supply - Gas Week: (3/19/14 - 3/26/14) | ||
|---|---|---|
Percent change for week compared with: |
||
last year |
last week |
|
| Gross Production | 4.48%
|
0.37%
|
| Dry Production | 4.44%
|
0.37%
|
| Canadian Imports | -15.98%
|
-6.24%
|
| West (Net) | -23.94%
|
-9.37%
|
| MidWest (Net) | -1.38%
|
14.66%
|
| Northeast (Net) | -19.13%
|
-26.54%
|
| LNG Imports | n/a
|
n/a
|
| Total Supply | 2.45%
|
-0.18%
|
| Source: BENTEK Energy LLC | ||
| U.S. Consumption - Gas Week: (3/19/14 - 3/26/14) | ||
|---|---|---|
Percent change for week compared with: |
||
last year |
last week |
|
| U.S. Consumption | -5.6%
|
1.8%
|
| Power | -9.7%
|
5.5%
|
| Industrial | -0.4%
|
-0.3%
|
| Residential/Commercial | -6.4%
|
1.4%
|
| Total Demand | -5.5%
|
1.9%
|
| Source: BENTEK Energy LLC | ||
| Rigs | |||
|---|---|---|---|
Fri, March 21, 2014 |
Change from |
||
last week |
last year |
||
| Oil Rigs | 1,473 |
0.82% |
11.25% |
| Natural Gas Rigs | 326 |
-5.23% |
-22.01% |
| Miscellaneous | 4 |
0.00% |
0.00% |
| Rig Numbers by Type | |||
|---|---|---|---|
Fri, March 21, 2014 |
Change from |
||
last week |
last year |
||
| Vertical | 384 |
-2.29% |
-11.11% |
| Horizontal | 1,206 |
-0.50% |
9.64% |
| Directional | 213 |
4.41% |
-0.47% |
| Source: Baker Hughes Inc. | |||
| Working Gas in Underground Storage | ||||
|---|---|---|---|---|
Stocks billion cubic feet (bcf) |
||||
| Region | 2014-03-21 |
2014-03-14 |
change |
|
| East | 356 |
395 |
-39 |
|
| West | 164 |
167 |
-3 |
|
| Producing | 376 |
391 |
-15 |
|
| Total | 896 |
953 |
-57 |
|
| Source: U.S. Energy Information Administration | ||||
| Working Gas in Underground Storage | |||||
|---|---|---|---|---|---|
Historical Comparisons |
|||||
Year ago (3/21/13) |
5-year average (2009-2013) |
||||
| Region | Stocks (Bcf) |
% change |
Stocks (Bcf) |
% change |
|
| East | 720 |
-50.6 |
775 |
-54.1 |
|
| West | 335 |
-51.0 |
293 |
-44.0 |
|
| Producing | 739 |
-49.1 |
754 |
-50.1 |
|
| Total | 1,795 |
-50.1 |
1,822 |
-50.8 |
|
| Source: U.S. Energy Information Administration | |||||
| Temperature -- Heating & Cooling Degree Days (week ending Mar 20) | ||||||||
|---|---|---|---|---|---|---|---|---|
HDD deviation from: |
CDD deviation from: |
|||||||
| Region | HDD Current |
normal |
last year |
CDD Current |
normal |
last year |
||
| New England | 244
|
46
|
2
|
0
|
0
|
0
|
||
| Middle Atlantic | 219
|
35
|
-4
|
0
|
0
|
0
|
||
| E N Central | 223
|
31
|
-20
|
0
|
0
|
0
|
||
| W N Central | 196
|
5
|
-36
|
0
|
-1
|
0
|
||
| South Atlantic | 135
|
28
|
16
|
9
|
-2
|
3
|
||
| E S Central | 114
|
12
|
10
|
0
|
-5
|
0
|
||
| W S Central | 65
|
5
|
23
|
4
|
-8
|
-13
|
||
| Mountain | 136
|
-20
|
21
|
2
|
0
|
-6
|
||
| Pacific | 48
|
-41
|
-6
|
0
|
-1
|
0
|
||
| United States | 155
|
10
|
-3
|
2
|
-2
|
-1
|
||
|
Note: HDD = heating degree-day; CDD = cooling degree-day Source: National Oceanic and Atmospheric Administration | ||||||||
Average temperature (°F)
7-Day Mean ending Mar 20, 2014
Source: NOAA/National Weather Service
Deviation between average and normal (°F)
7-Day Mean ending Mar 20, 2014
Source: NOAA/National Weather Service