In the News:
Record-high withdrawals from storage lead to record-low storage levels
The 262 billion cubic foot (Bcf) withdrawal from storage reported today placed Lower 48 natural gas storage levels at 1,923 Bcf, which continues the recent trend of storage levels falling below the 5-year range. During this heating season (November 1, 2013-March 31, 2014), cold weather has driven record-high cumulative withdrawals in each storage region of the Lower 48 states.
As a result, earlier in 2014, working gas levels in the Lower 48 states fell below the minimum storage level for the same week in the previous 5-years for the first time since EIA started reporting the statistic in 2004.
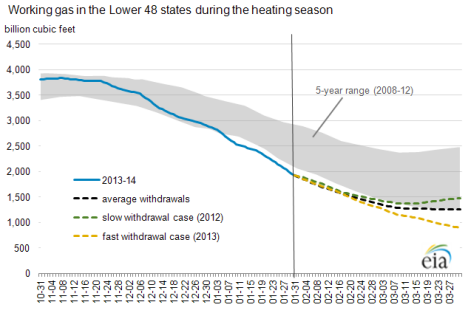
While storage levels for the remainder of the heating season are uncertain, the application of withdrawal rates based on the 5-year average (2009-13), as well as withdrawal rates based on history, provides a range of potential outcomes. The winters of 2011-12 and 2012-13 show historically low and high rates of withdrawal, respectively, because of mild winter weather during 2011-12 and colder-than-normal weather at the end of the 2012-13 heating season. For the Lower 48 states this year, these potential outcomes suggest working gas could reach between 905 Bcf in the high withdrawal case and 1,475 Bcf in the low withdrawal case, by the end of the heating season. In all but the fastest withdrawal scenario, storage levels return to the 5-year range by the end of the heating season.
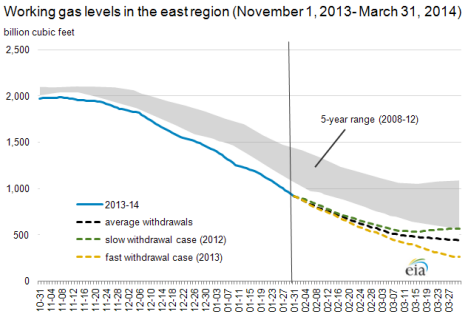
Lower 48 declines in working gas this winter have been driven primarily by large withdrawals in the East region. Since October 31, 2013, net withdrawals from storage in the East totaled 1,053 Bcf, exceeding the previous record-high of 1,051 Bcf reported over the same period during the 2002-03 heating season.
In contrast to the rest of the Lower 48 states, working gas storage levels in the East started out the heating season below the previous 5-year (2008-12) range. The rapid rate of withdrawals so far this heating season has increased the deficit relative to the 5-year range. Working gas levels in the East appear poised to end the heating season below the 5-year minimum for the region of 570 Bcf.
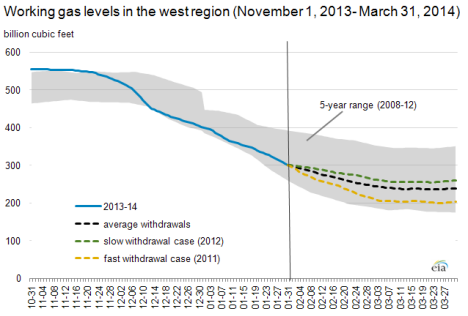
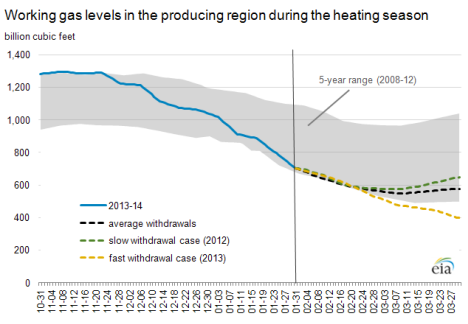
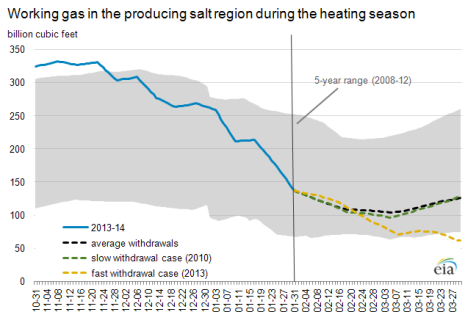
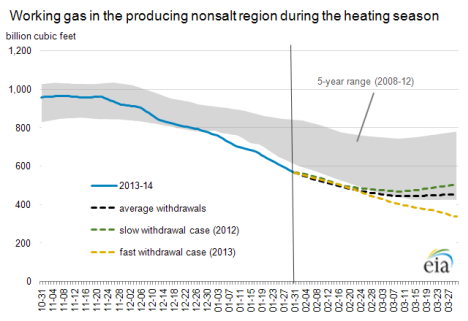
Working gas levels in both the West and Producing regions, in contrast to the East, have remained within their respective 5-year ranges, despite record-high withdrawals since October 31, 2013. In most of the future scenarios considered for these regions, working gas levels remain within their respective 5-year ranges. However, the high-withdrawal case in the Producing region results in working gas levels falling below the previous 5-year range. This potential outcome is driven by continued withdrawals at the nonsalt storage facilities, which primarily include depleted fields, in the Producing region. Compared with salt dome facilities, nonsalt storage facilities have less operational flexibility in cycling working gas levels. Generally, gas stored in depleted fields is injected (summer) and withdrawn (winter) once a year. Salt dome storage provides many injection/withdrawal cycles during a year.
Within the salt storage facilities of the Producing region, working gas levels have remained within the 5-year historical band and each of the scenarios suggests that working gas levels will stay within the 5-year range. In fact, the relative strength of working gas levels in salt dome facilities has kept total working gas levels in the Producing region within the previous 5-year range, as inventory levels at nonsalt facilities dipped below the previous 5-year range early in 2014.
Overview:
(For the Week Ending Wednesday, February 5, 2014)
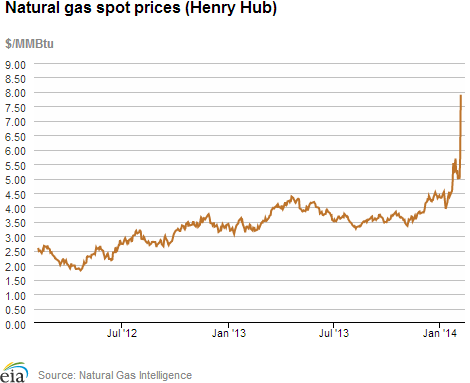
- Natural gas spot prices increased across most of the country, particularly in the Northeast, as another winter storm rolled across the Midwest and into the Northeast on Wednesday. The Henry Hub spot price increased from $5.20 per million British thermal units (MMBtu) last Wednesday, January 29, to $7.90/MMBtu yesterday.
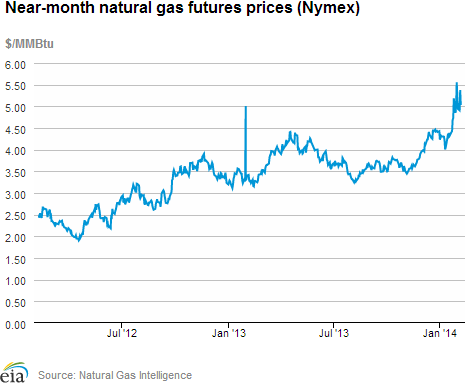
- At the New York Mercantile Exchange, the March 2014 futures contract declined from $5.465/MMBtu last Wednesday to $5.030/MMBtu yesterday. The near-month futures price is currently above the 12-month strip (the average of the March 2014 through February 2015 contracts), which settled at $4.614 yesterday.
- Working natural gas in storage decreased to 1,923 Bcf as of Friday, January 31, according to the U.S. Energy Information Administration (EIA) Weekly Natural Gas Storage Report (WNGSR). A net storage withdrawal of 262 Bcf for the week resulted in storage levels 28.8% below year-ago levels and 22.4% below the 5-year average.
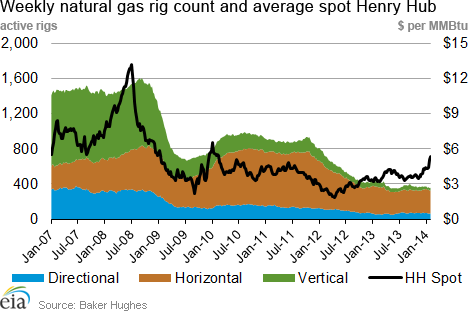
- The natural gas rotary rig count totaled 358 as of January 31, an increase of 2 from the previous week and down 70 from the same week last year, according to data released by Baker Hughes Inc. The oil rig count rose by 6 to 1,422 active units, up 90 from one year ago. The total rig count is 1,785, up 8 rigs from the previous week and up 21 from a year ago.
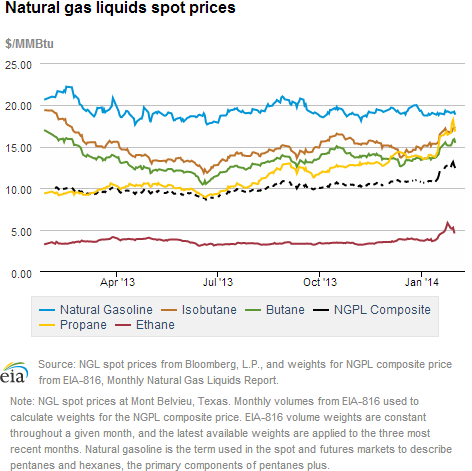
- The weekly average natural gas plant liquids composite price rose 1.4% this week (covering January 27 through January 31) compared to the previous week, and is now at $12.76/MMBtu. Propane spot prices at Mont Belvieu, Texas, rose significantly, driving the composite price higher despite lower ethane prices. The propane price rose by 4.8% over last week, while ethane declined by 4.7%. Butane and isobutane prices were up as well, rising by 1.5% and 0.6%, respectively. Natural gasoline prices declined by 0.5%.
Prices/Demand/Supply:
Prices rose across the country due to cold weather. The Henry Hub spot price in Erath, Louisiana, rose by $2.70/MMBtu, from $5.20/MMBtu last Wednesday, to $7.90/MMBtu yesterday. This is the highest Henry Hub has been since September 24, 2008. The widespread colder-than-normal temperatures experienced throughout January and into the first week of February are forecast to continue for another 5 days, helping to lift spot prices across the country. Prices in the Northeast started the report week relatively high, although nowhere near the extreme highs seen on some days earlier in January. On Thursday, prices for delivery to Transco Zone 6 serving New York City and Algonquin Citygate serving Boston declined $7.91/MMBtu and $4.31/MMBtu, respectively, as winter temperatures moderated. However, both trading points saw significant price increases again on Tuesday and Wednesday as another winter storm moved through the Northeast early Wednesday. Prices at Transco Zone 6 increased $3.62/MMBtu on Tuesday and $11.18 on Wednesday to end the report week at $20.77/MMBtu, up $6.51/MMBtu from the previous Wednesday. Prices at Algonquin Citygate increased $11.88/MMBtu on Tuesday and $1.15 on Wednesday to end the report week at $24.35/MMBtu, up $9.47/MMBtu from the previous Wednesday.
Much of the central part of the country also experienced significant price increases on Wednesday because of the cold weather and the potential for freeze-offs to reduce Rockies supplies. Prices in the Midcontinent region began the report week in the $5-$6/MMBtu range, but spiked yesterday to end the week in the $20-$40/MMBtu range. Farther north, in the Midwest region, which includes the Chicago Citygate point, prices followed a similar pattern, increasing by $10-$20/MMBtu on Wednesday after only moderate price changes earlier in the week. Chicago Citygate prices started the report week at $6.43/MMBtu, but increased $18.86/MMBtu on Wednesday to end the week at $27.45/MMBtu, the second-highest price on record, only surpassed by last Monday's high of $41.96/MMBtu. Chicago prices typically are in line with Henry Hub, so a Chicago price spike like this is extraordinary. Prices in the Rockies followed the same general pattern, with prices at the Opal trading point increasing $22.12/MMBtu on Wednesday to end the report week at an all-time high of $30.18/MMBtu.
Natural gas futures prices fell 43.5 cents/MMBtu over the week. The near-month (March 2014) futures contract decreased from $5.465/MMBtu last Thursday to $5.030/MMBtu yesterday, likely due to weather forecasts for more moderate temperatures beyond the next 5 days. Similarly, the 12-month strip (the average of the 12 contracts between March 2014 and February 2015) fell from $4.684/MMBtu January 29 to $4.614/MMBtu yesterday.
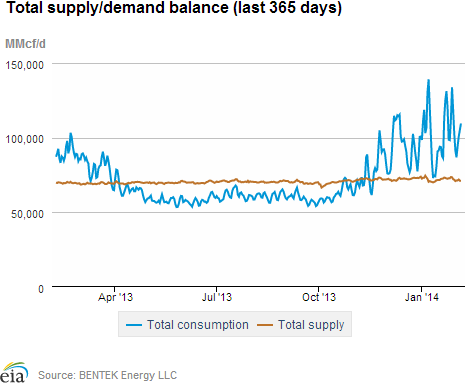
Gas consumption decreased as temperatures temporarily moderated. Total natural gas consumption for the report week fell 15.5% versus last week's levels, as temperatures were relatively moderate for most of the report week between winter storms. Consumption in the residential/commercial sectors drove the decline, falling 18.2%. However, the weather across most of the country remained significantly colder than normal, with consumption in the residential/commercial sector 9.9% higher than last year.
Electric sector consumption declined by 19.3%, driven largely by the Southeast. The largest volumetric decrease in electric sector gas consumption was in the Southeast, where power burn decreased from 7.7 billion cubic feet per day (Bcf/d) last report week to 5.4 Bcf/d this week. Power burn in the rest of the country was also down versus the previous week, except in the Southwest where electric sector consumption increased by 9.8% over the previous report week.
Decreased imports pushed supply down for the week. Bentek estimated dry production at 0.3% above the previous week's levels. Pipeline imports from Canada, however, declined by 17.9%, more than offsetting the production increases. LNG sendout also declined by 52.9%, but is a small piece of U.S. supply.
Storage
Gas in storage saw another sizeable net withdrawal. The net withdrawal reported for the week ending January 31, 262 Bcf, was the fifth highest net withdrawal since EIA started maintaining weekly storage statistics in 1993. It was 111 Bcf larger than the 5-year average of 151 Bcf and 133 Bcf larger than last year's net withdrawal of 129 Bcf. Current inventories totaling 1,923 Bcf are 778 Bcf (28.8%) less than last year at this time, 556 Bcf (22.4%) below the 5-year (2009-13) average, and 233 Bcf (10.8%) below the 5-year minimum.
Downward revision to last week's inventory levels. Resubmissions of data resulted in lowering estimates of working gas stocks in the Producing salt region by approximately 8 Bcf for the week ending January 24, 2014. The reported revision caused the stocks for January 24, 2014, to change from 2,193 Bcf to 2,185 Bcf. As a result, the implied net change between the weeks ending January 17 and January 24 changed from -230 Bcf to -238 Bcf.
Storage draw below market expectations of 272 Bcf. When the EIA storage report was released, the price for the March natural gas futures contract fell more than 10 cents on the New York Mercantile Exchange. At 10:30 a.m., the price of the near-month (March 2014) contract fell to $5.00/MMBtu. Prices rose to $5.09 in the hour following the release.
Net withdrawals in all three regions larger than average. The East, West, and Producing regions had net withdrawals of 143 Bcf, 26 Bcf, and 93 Bcf, respectively. All three gas storage regions remain below their year-ago, 5-year average levels, and 5-year minimums.
Temperatures during the storage report week significantly cooler than normal. Temperatures in the Lower 48 states averaged 27.0 degrees for the week, 6.6 degrees cooler than the 30-year normal temperature and 10.7 degrees cooler than during the same period last year.
See also:
| Spot Prices ($/MMBtu) | Thu, 30-Jan |
Fri, 31-Jan |
Mon, 3-Feb |
Tue, 4-Feb |
Wed, 5-Feb |
|---|---|---|---|---|---|
| Henry Hub |
5.29 |
5.01 |
5.02 |
5.75 |
7.90 |
| New York |
6.35
|
5.75 |
5.97 |
9.59 |
20.77 |
| Chicago |
6.44
|
6.96 |
6.91 |
8.59 |
27.45 |
| Cal. Comp. Avg,* |
5.34
|
5.17 |
6.25 |
7.97 |
22.96 |
| Futures ($/MMBtu) | |||||
| March Contract | 5.011 |
4.943 |
4.905 |
5.375 |
5.030 |
| April Contract |
4.358
|
4.454 |
4.507 |
4.665 |
4.546 |
| *Avg. of NGI's reported prices for: Malin, PG&E citygate, and Southern California Border Avg. | |||||
| Source: NGI's Daily Gas Price Index | |||||
| U.S. Natural Gas Supply - Gas Week: (1/29/14 - 2/5/14) | ||
|---|---|---|
Percent change for week compared with: |
||
last year |
last week |
|
| Gross Production | 1.75%
|
0.27%
|
| Dry Production | 1.73%
|
0.27%
|
| Canadian Imports | 16.48%
|
-17.88%
|
| West (Net) | 28.65%
|
-7.48%
|
| MidWest (Net) | 15.01%
|
-24.27%
|
| Northeast (Net) | -4.69%
|
-28.91%
|
| LNG Imports | -30.75%
|
-52.88%
|
| Total Supply | 2.64%
|
-2.01%
|
| Source: BENTEK Energy LLC | ||
| U.S. Consumption - Gas Week: (1/29/14 - 2/5/14) | ||
|---|---|---|
Percent change for week compared with: |
||
last year |
last week |
|
| U.S. Consumption | 5.7%
|
-15.5%
|
| Power | -0.3%
|
-19.3%
|
| Industrial | 1.5%
|
-3.7%
|
| Residential/Commercial | 9.9%
|
-18.2%
|
| Total Demand | 5.6%
|
-15.2%
|
| Source: BENTEK Energy LLC | ||
| Rigs | |||
|---|---|---|---|
Fri, January 31, 2014 |
Change from |
||
last week |
last year |
||
| Oil Rigs | 1,422 |
0.42% |
6.76% |
| Natural Gas Rigs | 358 |
0.56% |
-16.36% |
| Miscellaneous | 5 |
0.00% |
25.00% |
| Rig Numbers by Type | |||
|---|---|---|---|
Fri, January 31, 2014 |
Change from |
||
last week |
last year |
||
| Vertical | 392 |
-1.01% |
-11.91% |
| Horizontal | 1,173 |
0.26% |
3.26% |
| Directional | 220 |
4.27% |
20.22% |
| Source: Baker Hughes Inc. | |||
| Working Gas in Underground Storage | ||||
|---|---|---|---|---|
Stocks billion cubic feet (bcf) |
||||
| Region | 2014-01-31 |
2014-01-24 |
change |
|
| East | 920 |
1,063 |
-143 |
|
| West | 301 |
327 |
-26 |
|
| Producing | 702 |
795 |
-93 |
|
| Total | 1,923 |
2,185 |
-262 |
|
| Source: U.S. Energy Information Administration | ||||
| Working Gas in Underground Storage | |||||
|---|---|---|---|---|---|
Historical Comparisons |
|||||
Year ago (1/31/13) |
5-year average (2009-2013) |
||||
| Region | Stocks (Bcf) |
% change |
Stocks (Bcf) |
% change |
|
| East | 1,316 |
-30.1 |
1,232 |
-25.3 |
|
| West | 389 |
-22.6 |
357 |
-15.7 |
|
| Producing | 996 |
-29.5 |
889 |
-21.0 |
|
| Total | 2,701 |
-28.8 |
2,479 |
-22.4 |
|
| Source: U.S. Energy Information Administration | |||||
| Temperature -- Heating & Cooling Degree Days (week ending Jan 30) | ||||||||
|---|---|---|---|---|---|---|---|---|
HDD deviation from: |
CDD deviation from: |
|||||||
| Region | HDD Current |
normal |
last year |
CDD Current |
normal |
last year |
||
| New England | 325
|
50
|
22
|
0
|
0
|
0
|
||
| Middle Atlantic | 341
|
78
|
69
|
0
|
0
|
0
|
||
| E N Central | 376
|
83
|
131
|
0
|
0
|
0
|
||
| W N Central | 339
|
30
|
84
|
0
|
0
|
0
|
||
| South Atlantic | 259
|
79
|
94
|
2
|
-6
|
-7
|
||
| E S Central | 273
|
89
|
148
|
0
|
-1
|
-1
|
||
| W S Central | 184
|
51
|
130
|
0
|
-4
|
-13
|
||
| Mountain | 207
|
-18
|
12
|
0
|
-1
|
0
|
||
| Pacific | 74
|
-40
|
-41
|
0
|
-1
|
0
|
||
| United States | 266
|
44
|
72
|
0
|
-2
|
-3
|
||
|
Note: HDD = heating degree-day; CDD = cooling degree-day Source: National Oceanic and Atmospheric Administration | ||||||||
Average temperature (°F)
7-Day Mean ending Jan 30, 2014
Source: NOAA/National Weather Service
Deviation between average and normal (°F)
7-Day Mean ending Jan 30, 2014
Source: NOAA/National Weather Service