In the News:
California Power Suppliers Ask FERC for Relief from High Natural Gas Prices
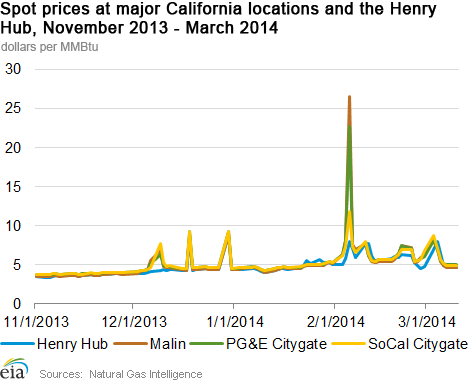
A group of California electric power suppliers filed for permission from the Federal Energy Regulatory Commission last week to better ensure recovery of costs incurred when natural gas prices spiked this winter. The power generators, which include NRG Energy Inc., Dynergy, and others, asked FERC to temporarily waive parts of the California Independent System Operator's tariff calculation provisions, which they deem do not allow "a generator to reflect significant day-to-day upward swings in natural gas prices." Instead, they want to bill the California Independent System Operator for the generators' actual gas procurement and disposal costs, thus allowing the generators to recover costs associated with short-term price spikes. The California group proposed that their temporary request is similar to waivers granted in the Northeast this winter.
The power producers cited prices in early February, when California spot prices rose to 10-year highs. Prices since then have moderated, but still have had a few spikes. Most recently, prices rose to the $8/MMBtu range in early March when cold weather in Eastern markets contributed to lower supply in California.
While California has not seen the intense cold that much of the United States has, the state has been affected by a drought this winter, which has substantially curtailed hydroelectric power generation. Natural gas-fired generation has filled much of the gap left by the decrease in hydro. For the period between January 1 and March 12, Bentek Energy estimated that hydro output was 53% (or about 1,035 megawatthours) less than during the same period last year. The loss was made up by thermal (natural gas) and nonhydro renewables. Additionally, total electric generation was down 3%.
EIA is forecasting that the West storage region will post a record natural gas withdrawal for the season. The current Short-Term Energy Outlook projects a net withdrawal for the region of 371 billion cubic feet (Bcf) between November and March, which far exceeds the previous record of 294. While the West region includes states that have been hit hard by this winter such as Minnesota, reduced flows into California, combined with increased demand, have likely contributed to the record storage withdrawal.
Overview:
(For the Week Ending Wednesday, March 12, 2014)
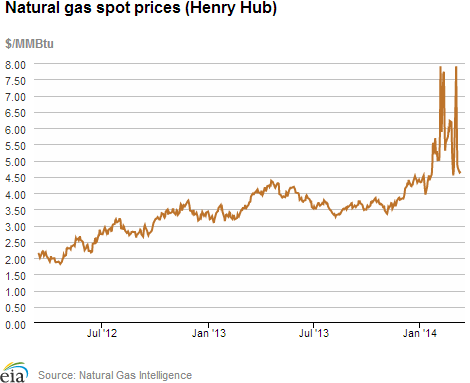
- With temperatures rising in most of the United States, natural gas spot prices declined during the report week (Wednesday, March 5, through Wednesday, March 12) at most locations. The Henry Hub spot price averaged $4.66 per million British thermal units (MMBtu) yesterday, a $1.75/MMBtu decrease for the report week.
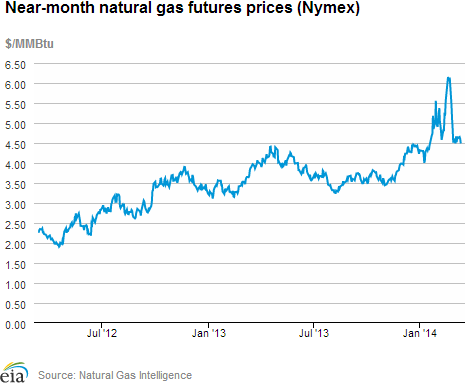
- At the New York Mercantile Exchange (Nymex), the April 2014 contract decreased to $4.490/MMBtu, a 3.3 cent/MMBtu decrease for the report week. The contract had increased to $4.605/MMBtu through trading on Tuesday, March 11, but its price dropped yesterday by 11.5 cents/MMBtu.
- Working natural gas in storage fell to 1,001 Bcf as of Friday, March 7, according to the U.S. Energy Information Administration (EIA) Weekly Natural Gas Storage Report (WNGSR). A net storage withdrawal of 195 Bcf for the week resulted in storage levels 48.9% below year-ago levels and 46.2% below the 5-year average.
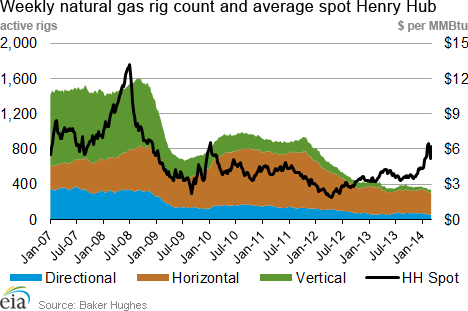
- The natural gas rotary rig count totaled 345 as of March 7. This represents an increase of 10 rigs from the previous week, but still down 62 rigs from the same time last year, according to data from Baker Hughes Inc. Oil rigs rose for the fourth week in a row, by 13 units to 1,443, which is 102 greater than last year at this time. The total rig count was 1,792, up 23 from last week and 40 from a year ago.
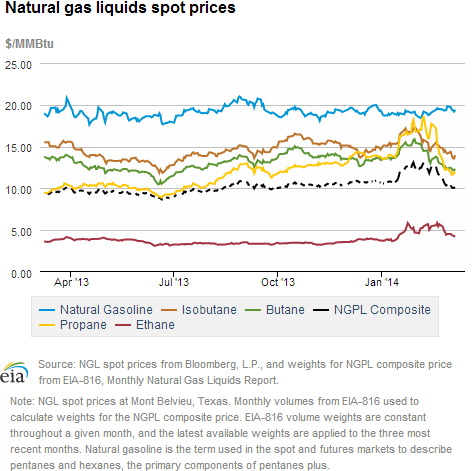
- The weekly average natural gas plant liquids composite price decreased for the fifth week in a row this week (covering March 3 through March 7), by 4.7%, and is now at $10.15/MMBtu. This is more than $2.50/MMBtu less than at the end of January, when the composite price was $12.69/MMBtu. The price of ethane decreased by 9.3%, while the price of propane decreased for the fourth week in a row, by 6.3%. Butane, isobutene, and natural gasoline prices also continued to slide, declining by 2.0%, 3.7%, and 0.2%, respectively.
Prices/Demand/Supply:
Henry Hub spot price drops to mid-$4/MMBtu range as temperatures warm. With the average daily Lower 48 temperature increasing by 33% over the previous week, to 47 degrees Fahrenheit, natural gas prices moderated this week. The Henry Hub spot price began the report week on Wednesday, March 5, averaging $6.41/MMBtu, and dropped the next day to $4.87/MMBtu, according to NGI price data. This coincided with a drop in natural gas demand. Prices decreased slightly from Thursday to $4.66/MMBtu the end of trading yesterday.
Prices fall at most regional hubs. A Wednesday-to-Wednesday price decrease took place at most U.S. natural gas hubs this week. The largest decreases occurred in the Midwest and Northeast, which also saw the highest price spikes during last week's cold snap. The Chicago Citygate spot price averaged $5.29/MMBtu yesterday, down $3.17/MMBtu compared to last Wednesday.
However, prices rose in the Northeast yesterday, likely in anticipation of a significant increase in demand resulting from today's cold weather. The Transco Zone 6-NY spot price averaged $6.45/MMBtu on Tuesday, but then rose sharply yesterday to $21.95/MMBtu, a $6.57/MMBtu increase over last Wednesday. The spot price at the Algonquin Citygate, which serves Boston area consumers, averaged $8.31/MMBtu on Tuesday, but then rose yesterday to $23.91/MMBtu. However, this still reflected a decrease of $4.50/MMBtu compared to last Wednesday's price at Algonquin, when the price remained high there following a cold snap.
April Nymex contract price declines. At the New York Mercantile Exchange (Nymex), the April 2014 contract increased through trading on Tuesday to $4.605/MMBtu. By the end of trading yesterday, however, it had decreased to $4.490/MMBtu, 3.3 cents/MMBtu lower than last Wednesday's closing price. The 12-month strip, or the average of all contracts from April 2014 to March 2015, rose to $4.627/MMBtu through trading on Tuesday, but then dropped yesterday to $4.540/MMBtu, a 2.3 cent/MMBtu decrease below last Wednesday's strip.
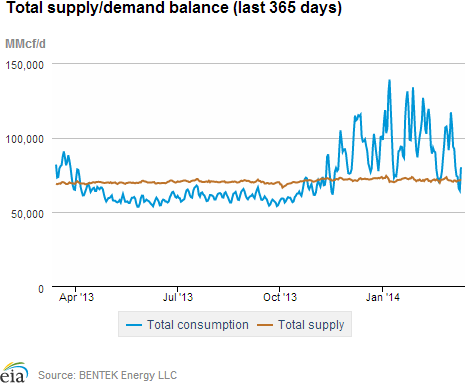
Consumption decreases in all sectors. Following an increase in all sectors last week, natural gas consumption decreased across all sectors for the current report week. Total U.S. consumption averaged 74.3 billion cubic feet per day (Bcf/d), 27% less than last report week's 101.4 Bcf/d average. Consumption dropped sharply from Thursday, March 6, to Friday, March 7, from 90.7 Bcf to 78.9 Bcf, and again over the weekend, when consumption averaged 72.5 Bcf/d. Total U.S. consumption dropped again on Monday, March 10, and Tuesday, March 11, when it averaged to 63.7 Bcf/d. Consumption rose sharply on Wednesday, March 12, to 78.4 Bcf, although this was still 15% less than demand on the previous Wednesday.
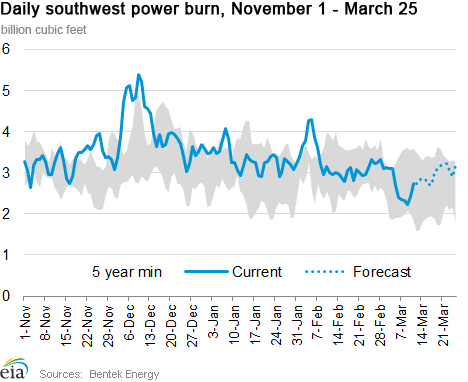
This trend essentially mirrored changes in consumption in the residential and commercial sector, which averaged 35.4 Bcf/d this report week, a 36% week-on-week decrease. Power burn also decreased for the report week, by 23% to 15.9 Bcf/d. However, unlike the residential and commercial sectors, power burn increased on Monday, March 10, and Tuesday, March 11. Although average temperatures on those dates were 53 degrees and 56 degrees, respectively, versus a 47-degree weekend average, lower natural gas prices likely made it relatively more profitable to run natural gas-fired generators in most of the country.
Overall for the week, power burn (natural gas used to fuel power plants) was still down in all regions except the Rockies. The Southeast, Northeast, and Texas each saw 0.9 Bcf/d decreases in average power burn this report week compared to last. Power burn also decreased by 0.8 Bcf/d in the Southwest, and by 0.4 Bcf/d in both the Pacific Northwest, and Midwest. The Pacific Northwest had the largest percentage decrease (75%) even as the region received higher-than-normal precipitation, increasing the water supply available for hydroelectric generation.
Industrial consumption also decreased this week, by 6%, while exports to Mexico decreased 5%.
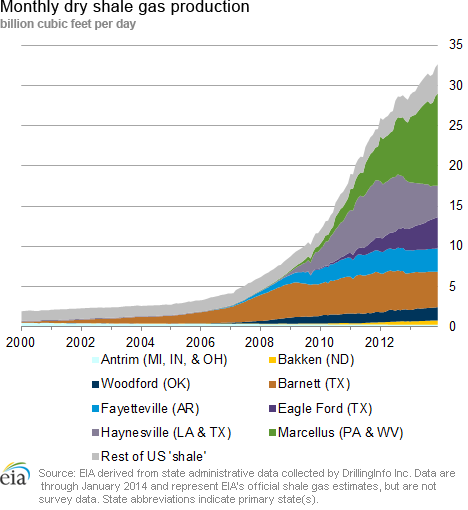
Decreased U.S. imports from Canada cause slight dip in supply. A 0.7 Bcf/d decrease in net U.S. natural gas imports from Canada exceeded a 0.6 Bcf/d increase in U.S. dry natural gas production this report week. When accounting for a 0.1 Bcf/d decrease in natural gas sent from liquefied natural gas (LNG) terminals, U.S. natural gas supply declined by 0.2 Bcf/d compared to the previous report week.
The largest drop in net U.S. natural gas imports from Canada this report week occurred in the Midwest, where imports dropped by 1.0 Bcf/d to 1.5 Bcf/d. Last week, net imports from Canada to the midwestern United States totaled 2.6 Bcf/d, their highest level in eight report weeks, as demand increased with cold temperatures. Net imports from Canada also decreased by 0.3 Bcf/d to the Northeast, but increased by 0.6 Bcf/d in the West.
Storage
Cooler weather brings a larger-than-average net withdrawal. The net withdrawal reported for the week ending March 7 was 195 Bcf, 100 Bcf larger than the 5-year average of 95 Bcf and 50 Bcf larger than last year's net withdrawal of 145 Bcf. Working gas inventories totaled 1,001 Bcf, 958 Bcf (48.9%) less than last year at this time, 858 Bcf (46.2%) below the 5-year (2009-13) average, and 622 Bcf (38.3%) below the 5-year minimum.
Storage draw falls below market expectations of 198 Bcf. When the EIA storage report was released at 10:30 a.m., the price for the April natural gas futures contract fell 2 cents to $4.40/MMBtu on the New York Mercantile Exchange (Nymex). Prices rose a few cents in the hour following the release.
Net withdrawals in all three regions larger than average. The East, West, and Producing regions had net withdrawals of 95 Bcf, 21Bcf, and 79 Bcf, respectively. Storage levels for all three regions remain below their year-ago, 5-year average levels, and 5-year minimums.
Temperatures during the storage report week significantly cooler than normal. Temperatures in the Lower 48 states averaged 31.1 degrees for the week, 9.9 degrees cooler than the 30-year normal temperature and 7.1 degrees cooler than during the same period last year.
See also:
| Spot Prices ($/MMBtu) | Thu, 6-Mar |
Fri, 7-Mar |
Mon, 10-Mar |
Tue, 11-Mar |
Wed, 12-Mar |
|---|---|---|---|---|---|
| Henry Hub |
4.87 |
4.77 |
4.63 |
4.65 |
4.66 |
| New York |
6.26 |
4.97 |
4.68 |
6.45 |
21.95 |
| Chicago |
6.80 |
8.72 |
4.92 |
5.38 |
5.29 |
| Cal. Comp. Avg,* |
4.95 |
4.79 |
4.77 |
4.75 |
4.72 |
| Futures ($/MMBtu) | |||||
| April Contract | 4.662 |
4.618 |
4.651 |
4.605 |
4.490 |
| May Contract |
4.603 |
4.567 |
4.576 |
4.544 |
4.441 |
| *Avg. of NGI's reported prices for: Malin, PG&E citygate, and Southern California Border Avg. | |||||
| Source: NGI's Daily Gas Price Index | |||||
| U.S. Natural Gas Supply - Gas Week: (3/5/14 - 3/12/14) | ||
|---|---|---|
Percent change for week compared with: |
||
last year |
last week |
|
| Gross Production | 4.15%
|
0.85%
|
| Dry Production | 4.11%
|
0.84%
|
| Canadian Imports | -10.44%
|
-12.94%
|
| West (Net) | -9.04%
|
38.73%
|
| MidWest (Net) | 2.20%
|
-40.03%
|
| Northeast (Net) | -30.60%
|
-25.00%
|
| LNG Imports | -27.67%
|
-35.23%
|
| Total Supply | 2.93%
|
-0.31%
|
| Source: BENTEK Energy LLC | ||
| U.S. Consumption - Gas Week: (3/5/14 - 3/12/14) | ||
|---|---|---|
Percent change for week compared with: |
||
last year |
last week |
|
| U.S. Consumption | -3.5%
|
-26.6%
|
| Power | -14.1%
|
-23.2%
|
| Industrial | 1.8%
|
-5.6%
|
| Residential/Commercial | -1.0%
|
-36.4%
|
| Total Demand | -3.2%
|
-26.3%
|
| Source: BENTEK Energy LLC | ||
| Rigs | |||
|---|---|---|---|
Fri, March 07, 2014 |
Change from |
||
last week |
last year |
||
| Oil Rigs | 1,443 |
0.91% |
7.61% |
| Natural Gas Rigs | 345 |
2.99% |
-15.23% |
| Miscellaneous | 4 |
0.00% |
0.00% |
| Rig Numbers by Type | |||
|---|---|---|---|
Fri, March 07, 2014 |
Change from |
||
last week |
last year |
||
| Vertical | 392 |
0.26% |
-8.20% |
| Horizontal | 1,202 |
1.78% |
6.37% |
| Directional | 198 |
0.51% |
1.54% |
| Source: Baker Hughes Inc. | |||
| Working Gas in Underground Storage | ||||
|---|---|---|---|---|
Stocks billion cubic feet (bcf) |
||||
| Region | 2014-03-07 |
2014-02-28 |
change |
|
| East | 430 |
525 |
-95 |
|
| West | 169 |
190 |
-21 |
|
| Producing | 402 |
481 |
-79 |
|
| Total | 1,001 |
1,196 |
-195 |
|
| Source: U.S. Energy Information Administration | ||||
| Working Gas in Underground Storage | |||||
|---|---|---|---|---|---|
Historical Comparisons |
|||||
Year ago (3/7/13) |
5-year average (2009-2013) |
||||
| Region | Stocks (Bcf) |
% change |
Stocks (Bcf) |
% change |
|
| East | 843 |
-49.0 |
825 |
-47.9 |
|
| West | 340 |
-50.3 |
296 |
-42.9 |
|
| Producing | 776 |
-48.2 |
737 |
-45.5 |
|
| Total | 1,959 |
-48.9 |
1,859 |
-46.2 |
|
| Source: U.S. Energy Information Administration | |||||
| Temperature -- Heating & Cooling Degree Days (week ending Mar 06) | ||||||||
|---|---|---|---|---|---|---|---|---|
HDD deviation from: |
CDD deviation from: |
|||||||
| Region | HDD Current |
normal |
last year |
CDD Current |
normal |
last year |
||
| New England | 319
|
91
|
115
|
0
|
0
|
0
|
||
| Middle Atlantic | 314
|
99
|
99
|
0
|
0
|
0
|
||
| E N Central | 347
|
119
|
85
|
0
|
-1
|
0
|
||
| W N Central | 359
|
130
|
93
|
0
|
-1
|
0
|
||
| South Atlantic | 192
|
59
|
16
|
7
|
-3
|
6
|
||
| E S Central | 181
|
53
|
-6
|
0
|
-3
|
0
|
||
| W S Central | 147
|
66
|
33
|
3
|
-6
|
1
|
||
| Mountain | 159
|
-16
|
-14
|
1
|
0
|
1
|
||
| Pacific | 81
|
-15
|
4
|
0
|
-1
|
0
|
||
| United States | 239
|
68
|
51
|
2
|
-1
|
1
|
||
|
Note: HDD = heating degree-day; CDD = cooling degree-day Source: National Oceanic and Atmospheric Administration | ||||||||
Average temperature (°F)
7-Day Mean ending Mar 06, 2014
Source: NOAA/National Weather Service
Deviation between average and normal (°F)
7-Day Mean ending Mar 06, 2014
Source: NOAA/National Weather Service