In the News:
Marcellus production strong; backlogged wells will support further growth
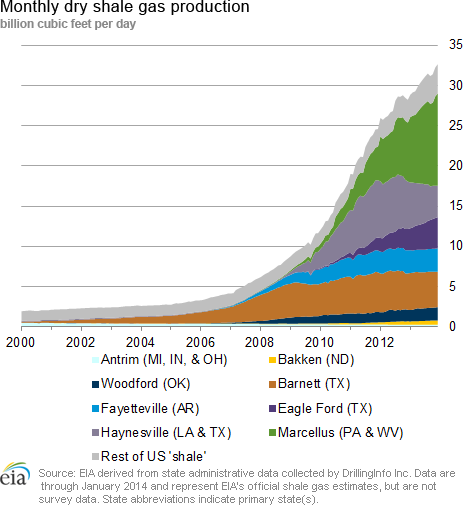
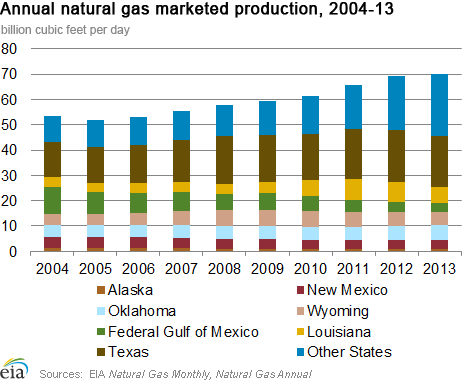
EIA's recently released December 2013 data indicate that 2013 was a record year for U.S. gas production, with consistent growth in the "other states" category, which include states with active Marcellus shale production. According to EIA's monthly production survey (EIA-914), overall marketed production in the United States averaged 70.2 billion cubic feet per day (Bcf/d) in 2013, up about 1 Bcf/d (1.5%) from 2012 and the eighth straight year of production growth. Much of the growth came from states other than the more widely known hydrocarbon-producing states of Louisiana, Wyoming, New Mexico, Texas, Oklahoma, and Alaska. Growth in the Marcellus states has more than offset declines in other areas, particularly the Gulf of Mexico.
EIA's monthly Drilling Productivity Report, which uses different methodology than the monthly survey and which estimates production by shale play, estimated that Marcellus gross natural gas production grew 47.6% from 2012 to 2013. EIA forecasts that the overall growth in U.S. marketed production will continue in 2014, averaging 71.8 Bcf/d (or, plus 2.3%), according to EIA's February Short-Term Energy Outlook.
A current backlog of natural gas wells, or wells that have been drilled but not yet completed so they can produce natural gas, will be a major contributing factor to future growth in production, particularly in the Marcellus Shale. A Barclays report on February 28 estimated that more than 1,300 wells in Pennsylvania remain backlogged. Backlogs are often the result of inadequate pipeline infrastructure in a region to support production. As new infrastructure becomes available, these wells can quickly begin producing.
There have been proposals for additional takeaway capacity to move natural gas out of the Marcellus, and last week ANR Pipeline asked shippers for capacity commitments to flow natural gas out of the Marcellus to the Gulf Coast on ANR's Southeast mainline. ANR said that total capacity would be 0.65 Bcf /d. Additionally, two weeks ago Natural Gas Pipeline Company (NGPL) issued a nonbinding open season to gauge interest in an expansion on its Gulf Coast mainline system. The expansion would move gas from the Marcellus and Utica shales to markets in Texas and Louisiana, using an interconnection between NGPL and the Rockies Express Pipeline in Illinois.
Overview:
(For the Week Ending Wednesday, March 5, 2014)
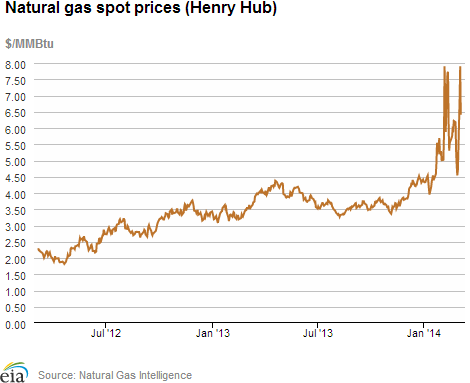
- With another wave of cold weather, natural gas spot prices rose during the report week (Wednesday, February 26, through Wednesday, March 5) at most locations. The Henry Hub spot price traded yesterday at $6.41 per million British thermal units (MMBtu), a $1.57/MMBtu increase for the report week. It rose to $7.90/MMBtu on Tuesday, March 4, before declining yesterday.
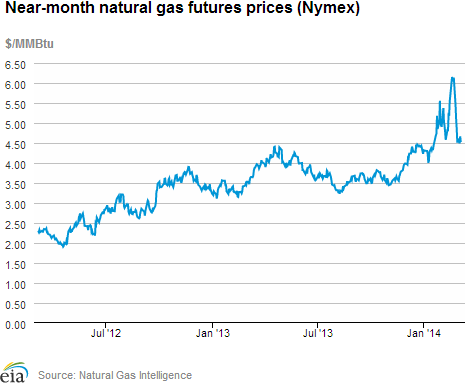
- At the New York Mercantile Exchange (Nymex), the April 2014 contract traded yesterday at $4.523/MMBtu, a 1.3 cent decrease for the report week. The April contract took over as the front month contract on Thursday, February 27.
- Working natural gas in storage fell to 1,196 billion cubic feet (Bcf) as of Friday, February 28, according to the U.S. Energy Information Administration (EIA) Weekly Natural Gas Storage Report (WNGSR). A net storage withdrawal of 152 Bcf for the week resulted in storage levels 43.2% below year-ago levels and 38.8% below the 5-year average.
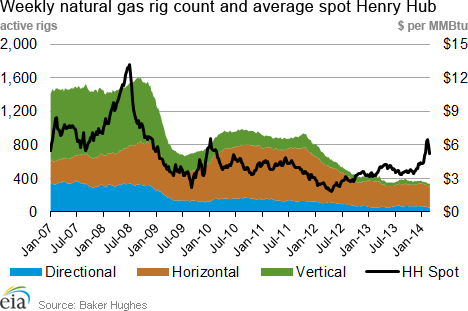
- The total rig count was 1,769, up 12 from a year ago.The natural gas rotary rig count totaled 335 as of February 28, which represents a decline of 7 rigs from the previous week, and 85 rigs from the same time last year, according to data from Baker Hughes Inc. Oil rigs rose for the third week in a row, by 5 units to 1,430, which is 97 greater than last year at this time.
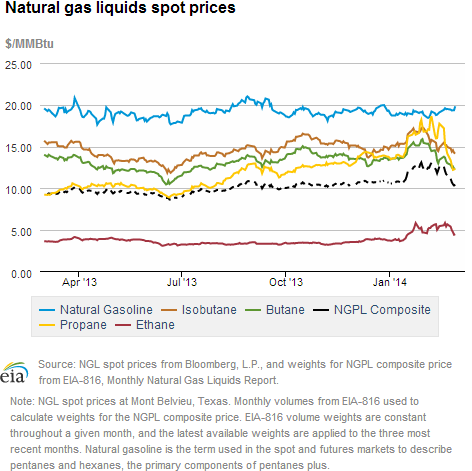
- The weekly average natural gas plant liquids composite price decreased for the fourth week in a row this week (covering February 24 through February 28), by 11.2%, and is now at $10.65/MMBtu. This is more than $2.00/MMBtu less than at the end of January, when the composite price was $12.69/MMBtu. This week, prices of ethane and propane, the two largest components of the NGL composite price, decreased by 14.4% and 18.0%, respectively. Butane, isobutene, and natural gasoline declined by 6.6%, 5.2%, and 0.2%, respectively.
Prices/Demand/Supply:
Henry Hub spot price nears $8/MMBtu. A drop in temperatures across the country on Monday, March 3, and Tuesday, March 4, drove consumption to more than 100 Bcf/d on both of these days. On Tuesday, the Henry Hub spot price rose to $7.90/MMBtu, its highest level since the winter storm in early February. The temperature in New Orleans decreased to 36 degrees Fahrenheit on Tuesday, its lowest level in more than a month and 19 degrees less than the average for that date over the previous five years, according to data from Bloomberg. Although the Henry Hub spot price declined yesterday to $6.41/MMBtu, it still gained $1.57/MMBtu over the report week.
Prices spike in the Midwest. Spot prices at the Chicago Citygate, which are normally very close to the Henry Hub price, reached $36.27/MMBtu on Friday, February 28, and remained above $28/MMBtu through trading yesteray. Prices in Chicago reached their highest level since they jumped to a record $41.96/MMBtu on January 27. Average daily temperatures in Chicago for this report week averaged 14 degrees, 16 degrees less than the five-year average. Increased natural gas demand in the Gulf region tightened the supply of natural gas from the Gulf transported to Chicago consumers via the ANR Pipeline. This was also the case for Rockies gas transported to Chicago consumers on the Rockies Express Pipeline, as temperatures in Denver dropped on Sunday to 14 degrees, 27 degrees less than the average for that date over the previous five years.
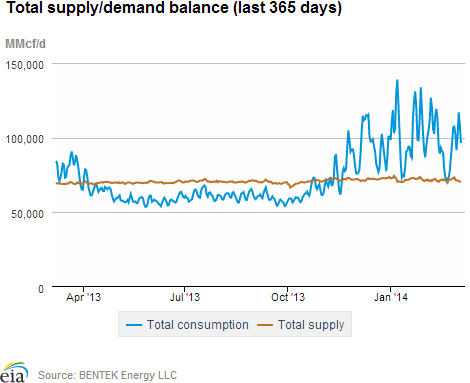
Natural gas net deliveries from Canada into the Midwest increased on the Great Lakes Gas Transmission (GLGT) pipeline from Saturday, March 1, to Monday, March 3. GLGT interconnects at U.S.-Canadian border points with the TransCanada Mainline, which transports supply from western Canada. Western Canadian supply has become increasingly expensive, with demand in western Alberta increasing significantly this week, according to Bentek. Calgary temperatures dropped to -28 degrees Fahrenheit on Saturday and to -26 degrees on Sunday, 24 degrees and 21 degrees below the average for the last five years, respectively. The average spot price for gas traded at Niska's AECO Hub reached $8.01/MMBtu on Monday, versus AECO's $5.37/MMBtu price at the beginning of the report week. Prices remain high in New England, but decrease in New York. Similar to Chicago, the natural gas spot price at the Algonquin Citygate hub serving Boston area consumers rose above $30/MMBtu this weekend. The Algonquin Citygate price reached $32.57/MMBtu on Friday, and finished the report week at $28.41/MMBtu. The Transco Zone 6-New York spot price was also high at the beginning of the report week, trading at $24.44/MMBtu on Wednesday, February 26. New York, like Boston, had temperatures drop below 20 degrees Fahrenheit at the end of the report week, but saw its spot price decline during the report week, trading yesterday at $15.38/MMBtu. Despite these bitterly cold temperatures, New York's access to increased takeaway capacity from the Marcellus Shale likely contributed to prices there decreasing while Boston prices remained high. Additionally, tightening supply from Canada had a greater effect on the Boston market. Canadian offshore production dropped sharply on Monday and TransCanada deliveries via the Iroquois Pipeline and Portland Natural Gas Transmission System fell from Saturday, March 1, to Monday, March 3, according to data from Bentek. Deliveries of Canadian offshore production on the Maritimes & Northeast (M&N) Pipeline fell on Monday, March 3 and Tuesday, March 4, with a large delivery on Monday of relatively more expensive liquefied natural gas (LNG) transported on M&N from Repsol's Canaport LNG terminal. The spot price at the Dawn hub serving Toronto area consumers reached $46.68/MMBtu on Friday, February 28, and $35.27/MMBtu on Monday, March 3. April Nymex futures contract price declines. At the New York Mercantile Exchange (Nymex), the April 2014 contract decreased by 1.3 cents/MMBtu over the report week to $4.523/MMBtu. The April contract took over as the front month contract on Thursday, February 27. On Wednesday, February 26, the March 2014 contract settled at $4.855/MMBtu. This was a significant decrease from Wednesday, February 19, when it traded at $6.149/MMBtu, the largest near-month futures price movement in more than four years. Consumption increased in all sectors. Consumption increased in all sectors this week, with the biggest increase taking place during Monday's cold snap. Consumption this report week averaged 101.8 Bcf/d. This was 24% higher than last week's average of 81.8 Bcf/d, and 19% higher than consumption during the same week in 2013. Most of the 20.0 Bcf/d increase in average consumption over last week came from the residential and commercial sector, which saw consumption rise by 13.6 Bcf/d (32%) to 56.0 Bcf/d. Industrial consumption and Mexican exports both rose over week-ago levels despite this week's higher prices, while power burn rose nationally by 5.0 Bcf/d (32%) over last week to 20.8 Bcf/d. Power burn was flat or down in the western United States, but rose by 1.8 Bcf/d (40%) in the Southeast, 1.3 Bcf/d (53%) in Texas, and 1.2 Bcf/d (34%) in the Northeast. Lower production causes supply to decrease. Dry natural gas production decreased this report week to 66.0 Bcf/d. This was 0.8 Bcf/d (1.3%) below last week's average of 66.9 Bcf/d, which was the highest weekly average since November. Trade press reports indicate that cold weather likely had an impact on production levels, although dry gas production for the report week still reached its third-highest weekly average in 2014. Net imports from Canada rose by 0.5 Bcf/d (11%). Midwestern U.S. imports from Canada increased by 0.5 Bcf/d (27%), and Northeastern U.S. imports from Canada increased by 0.3 Bcf/d (38%), despite a sharp drop over the weekend. A 0.3 Bcf/d (16%) decrease in Western U.S. imports from Canada partially offset these increases, while LNG imports were essentially flat.Storage
Cooler weather brings a larger-than-average net withdrawal. The net withdrawal reported for the week ending February 28 was 152 Bcf, 47 Bcf larger than the 5-year average of 105 Bcf and 3 Bcf larger than last year's net withdrawal of 149 Bcf. Working gas inventories totaled 1,196 Bcf, 908 Bcf (43.2%) less than last year at this time, 758 Bcf (38.8%) below the 5-year (2009-13) average, and 509 Bcf (29.9%) below the 5-year minimum.
Storage draw exceeds market expectations of 138 Bcf. When the EIA storage report was released at 10:30 a.m., the price for the April natural gas futures contract increased 10 cents to $4.65/MMBtu on the New York Mercantile Exchange (Nymex). Prices rose a few more cents in the hour following the release.
Net withdrawals in all three regions larger than average. The East, West, and Producing regions had net withdrawals of 82 Bcf, 27 Bcf, and 43 Bcf, respectively. Storage levels for all three regions remain below their year-ago, 5-year average levels, and 5-year minimums.
Temperatures during the storage report week cooler than normal. Temperatures in the Lower 48 states averaged 36.9 degrees for the week, 2.4 degrees cooler than the 30-year normal temperature, but similar to the degree days recorded during the same period last year.
See also:
| Spot Prices ($/MMBtu) | Thu, 27-Feb |
Fri, 28-Feb |
Mon, 3-Mar |
Tue, 4-Mar |
Wed, 5-Mar |
|---|---|---|---|---|---|
| Henry Hub |
4.54 |
4.70 |
6.86 |
7.90 |
6.41 |
| New York |
19.88 |
16.75 |
22.78 |
12.26 |
15.38 |
| Chicago |
18.50 |
36.27 |
24.61 |
10.25 |
8.46 |
| Cal. Comp. Avg,* |
5.71 |
6.09 |
8.32 |
6.94 |
5.43 |
| Futures ($/MMBtu) | |||||
| April Contract | 4.511 |
4.609 |
4.492 |
4.667 |
4.523 |
| May Contract |
4.474 |
4.550 |
4.455 |
4.583 |
4.484 |
| *Avg. of NGI's reported prices for: Malin, PG&E citygate, and Southern California Border Avg. | |||||
| Source: NGI's Daily Gas Price Index | |||||
| U.S. Natural Gas Supply - Gas Week: (2/26/14 - 3/5/14) | ||
|---|---|---|
Percent change for week compared with: |
||
last year |
last week |
|
| Gross Production | 3.66%
|
-1.27%
|
| Dry Production | 3.62%
|
-1.26%
|
| Canadian Imports | 6.38%
|
10.96%
|
| West (Net) | -30.83%
|
-16.23%
|
| MidWest (Net) | 59.60%
|
26.74%
|
| Northeast (Net) | 7.17%
|
37.98%
|
| LNG Imports | -52.96%
|
-0.08%
|
| Total Supply | 3.51%
|
-0.46%
|
| Source: BENTEK Energy LLC | ||
| U.S. Consumption - Gas Week: (2/26/14 - 3/5/14) | ||
|---|---|---|
Percent change for week compared with: |
||
last year |
last week |
|
| U.S. Consumption | 19.0%
|
24.4%
|
| Power | 0.9%
|
31.7%
|
| Industrial | 5.1%
|
3.9%
|
| Residential/Commercial | 35.2%
|
32.1%
|
| Total Demand | 19.0%
|
24.1%
|
| Source: BENTEK Energy LLC | ||
| Rigs | |||
|---|---|---|---|
Fri, February 28, 2014 |
Change from |
||
last week |
last year |
||
| Oil Rigs | 1,430 |
0.35% |
7.28% |
| Natural Gas Rigs | 335 |
-2.05% |
-20.24% |
| Miscellaneous | 4 |
0.00% |
0.00% |
| Rig Numbers by Type | |||
|---|---|---|---|
Fri, February 28, 2014 |
Change from |
||
last week |
last year |
||
| Vertical | 391 |
-0.26% |
-9.28% |
| Horizontal | 1,181 |
-0.08% |
3.51% |
| Directional | 197 |
0.00% |
6.49% |
| Source: Baker Hughes Inc. | |||
| Working Gas in Underground Storage | ||||
|---|---|---|---|---|
Stocks billion cubic feet (bcf) |
||||
| Region | 2014-02-28 |
2014-02-21 |
change |
|
| East | 525 |
607 |
-82 |
|
| West | 190 |
217 |
-27 |
|
| Producing | 481 |
524 |
-43 |
|
| Total | 1,196 |
1,348 |
-152 |
|
| Source: U.S. Energy Information Administration | ||||
| Working Gas in Underground Storage | |||||
|---|---|---|---|---|---|
Historical Comparisons |
|||||
Year ago (2/28/13) |
5-year average (2009-2013) |
||||
| Region | Stocks (Bcf) |
% change |
Stocks (Bcf) |
% change |
|
| East | 933 |
-43.7 |
895 |
-41.3 |
|
| West | 346 |
-45.1 |
304 |
-37.5 |
|
| Producing | 825 |
-41.7 |
754 |
-36.2 |
|
| Total | 2,104 |
-43.2 |
1,954 |
-38.8 |
|
| Source: U.S. Energy Information Administration | |||||
| Temperature -- Heating & Cooling Degree Days (week ending Feb 27) | ||||||||
|---|---|---|---|---|---|---|---|---|
HDD deviation from: |
CDD deviation from: |
|||||||
| Region | HDD Current |
normal |
last year |
CDD Current |
normal |
last year |
||
| New England | 249
|
6
|
23
|
0
|
0
|
0
|
||
| Middle Atlantic | 242
|
13
|
19
|
0
|
0
|
0
|
||
| E N Central | 301
|
56
|
46
|
0
|
0
|
0
|
||
| W N Central | 327
|
81
|
35
|
0
|
0
|
0
|
||
| South Atlantic | 134
|
-11
|
-17
|
13
|
5
|
-2
|
||
| E S Central | 155
|
15
|
13
|
0
|
-2
|
0
|
||
| W S Central | 98
|
7
|
-9
|
2
|
-2
|
1
|
||
| Mountain | 165
|
-20
|
-80
|
1
|
0
|
1
|
||
| Pacific | 72
|
-25
|
-53
|
0
|
-1
|
0
|
||
| United States | 200
|
17
|
0
|
3
|
0
|
0
|
||
|
Note: HDD = heating degree-day; CDD = cooling degree-day Source: National Oceanic and Atmospheric Administration | ||||||||
Average temperature (°F)
7-Day Mean ending Feb 27, 2014
Source: NOAA/National Weather Service
Deviation between average and normal (°F)
7-Day Mean ending Feb 27, 2014
Source: NOAA/National Weather Service