In the News:
Rising prices in eastern Australia spur new investment proposals
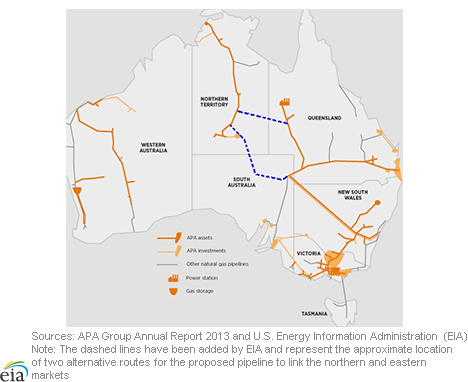
Last week, APA Group, which owns and operates natural gas pipelines in Australia, announced that it would spend A$2 million (Australian dollars, equivalent to US$1.8 million) on a feasibility study for a pipeline linking Australia's northern and eastern natural gas markets. Prices in the eastern market have increased over the past few years, going from around A$2-4 per gigajoule (GJ) (US$2.30-$4.50 per million British thermal units (MMBtu)) in 2010 to around A$5-$9/GJ (US$6.00-$10.80/MMBtu) in 2013. Recent tightness in the eastern market can be attributed to a number of factors, including the impending start-up of liquefied natural gas (LNG) export facilities. At the same time, many eastern-market buyers are seeking new long-term supply contracts as a significant portion of the existing contracts expire over the next few years. The higher prices increase the incentive for investment in expanded and new supply options, such as the proposed pipeline.
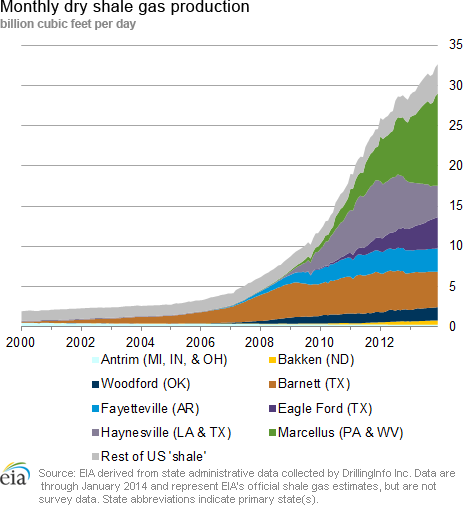
In 2012, Australia was the world's third-largest exporter of LNG, with exports of 990 Bcf. Of that, 71% went to Japan and 17% went to China.
Australia has three distinct market areas for natural gas. There are currently no pipelines linking the three market areas, and prices in the three regions have developed largely independently of one another. The western market covers the state of Western Australia and the offshore fields in the Carnarvon and Browse basins, with most of the production from these fields exported as LNG. Similarly, the northern market covers Australia's Northern Territory, including production from the offshore Bonaparte Basin in the Timor Sea, most of which is exported as LNG.
The eastern market includes more than half of the country's gas-consuming regions, including the states of Queensland, Victoria, New South Wales, South Australia, and Tasmania. While most production in the western and northern markets has been dedicated to LNG exports, eastern market production has been entirely for domestic consumption. However, there are three LNG projects under construction in the eastern market, with commercial exports from the first project expected in the second half of 2014. The other two liquefaction plants and terminals are due to begin exports in 2015. When all three export facilities in the eastern market are complete and exporting at full capacity, they would be the dominant consumers of eastern market production.
Most gas consumed in Australia is bought and sold under long-term bilateral contracts. Market prices in the western and northern markets must be estimated, as there are no hubs at which gas is openly traded and where the resulting prices are known publicly (such as Henry Hub in the United States). In the eastern market, most gas is also traded under long-term contracts with the price of that gas not known publicly. However, in recent years, with support from regulators and market participants, several transparent trading points have developed in Australia's eastern gas market. There are three citygate points (Adelaide, Brisbane, and Sydney) for short-term trading of gas. The Australian Energy Market Operator is also developing an upstream trading hub in the Bowen-Surat Basin, in southeast Queensland, which is set to be launched next month. Only in Victoria is there a long-established transparent market for gas. The Victoria Wholesale Gas Market was established in 1999 with spot gas traded on the market and contract futures available on the Australian Securities Exchange.
Overview:
(For the Week Ending Wednesday, February 26, 2014)
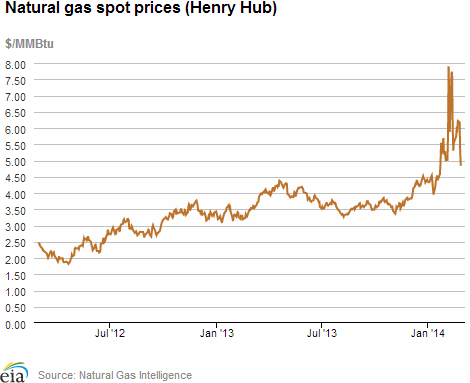
- Natural gas spot prices generally increased during most of the report week, but fell sharply on Tuesday and Wednesday. The Henry Hub spot price closed down at $4.84/MMBtu on Wednesday, February 26, $1.13/MMBtu below last Wednesday's price. Prices at major Northern population centers increased more consistently throughout the report period.
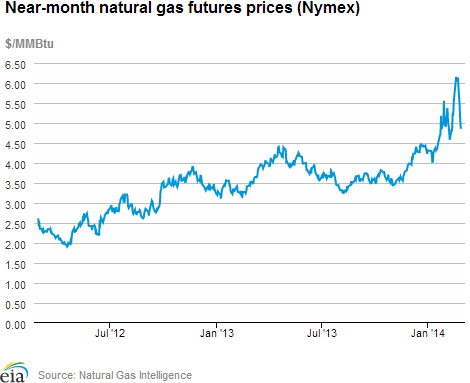
- Prices at the New York Mercantile Exchange (Nymex) fell on Monday despite increasingly cold weather, after increasing during most of the first half of the report week (Wednesday to Wednesday). The March contract price began last Wednesday at $6.149/MMBtu and settled yesterday at $4.855/MMBtu with the expiration of the March contract.
- • Working natural gas in storage decreased to 1,348 billion cubic feet (Bcf) as of Friday, February 21, according to the U.S. Energy Information Administration (EIA) Weekly Natural Gas Storage Report (WNGSR). A net storage withdrawal of 95 Bcf for the week resulted in storage levels 40.2% below year-ago levels and 34.5% below the 5-year average.
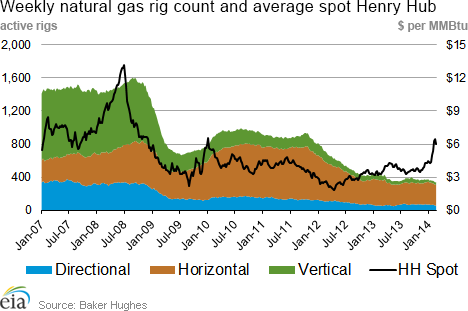
- The total rig count rose by 7 from the previous week, up 10 from the same time last year, according to data released by Baker Hughes Inc. The natural gas rotary rig count was 342 as of February 21, an increase of 5 relative to last week, but 86 below last year's figure. The gas rig count has generally been declining since the start of the year. The oil rig count was 1,425, an increase of 2 from the previous week and 96 rigs greater than the same time last year.
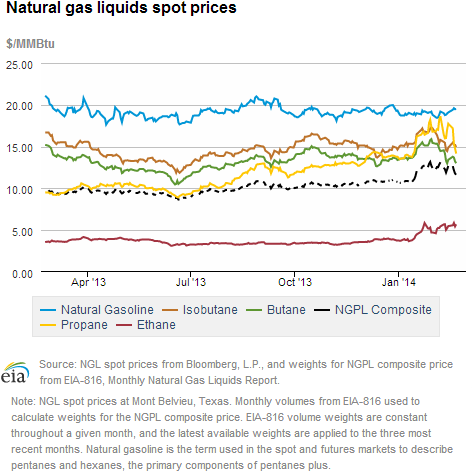
- The weekly average natural gas plant liquids composite price fell by 2.1% this week (covering February 17 through February 21) compared to the previous week, and is now at $12.06/MMBtu. This decrease was driven by spot propane at Mont Belvieu, which dropped 7.7% as weather moderated over the previous week, reducing demand for home heating fuel. The ethane and natural gasoline spot prices at Mont Belvieu increased by 3.9% and 3.0%, respectively.
Prices/Demand/Supply:
Henry Hub prices rise last week, fall this week. The Henry Hub spot price increased during the first half of the report week, likely in anticipation of cooler weather, and then decreased at the end of the report week. On Tuesday, the Henry Hub price decreased by 93 cents to $5.25/MMBtu, a day after a large decline in the near-month Nymex price. Aside from the large price movements earlier this month, the Henry Hub price has not moved so sharply since January 2010. It closed at $4.84/MMBtu yesterday, down $1.13/MMBtu over the report week. Many other spot prices saw a similar pattern, including Opal in Wyoming, Malin in Northern California, and Katy in East Texas.
Spot points delivering to major Northern population centers saw prices increase more consistently across the report week with the progressive decline in temperatures. The Algonquin Citygate price, delivering to Boston, began the week at $13.83/MMBtu last Wednesday and closed at $29.41/MMBtu yesterday. The Transco Zone-6 NY price, delivering to New York City, rose from $6.10/MMBtu last Wednesday to $24.44/MMBtu yesterday. Chicago Citygate and trading points all across the Midwest saw similarly elevated prices and comparable price movements.
Futures prices fall sharply on Monday and Tuesday, closing down on Wednesday. The near-month futures price for March delivery began the week at $6.149/MMBtu last Wednesday, falling sharply Monday. Despite expectations for cooler-than-average March weather, the futures price fell by $0.690 between Friday and Monday, closing at $5.445/MMBtu on Monday, and continuing to fall sharply on Tuesday. The price decrease from Friday to Monday was the largest near-month futures price movement in more than four years. The March contract continued to decline yesterday, settling at $4.855/MMBtu as the March futures contract expired, giving way to the April contract.
This week's futures price movements downward are inconsistent with falling temperatures Friday through Wednesday. This may be attributed to activity surrounding yesterday's expiration of the March futures contract. Expectations for gas markets may have changed with revisions to near-term weather forecasts (despite the fact that they are still calling for below-average temperatures), and possibly with overall market realignment because of rising production and low-but-adequate storage.
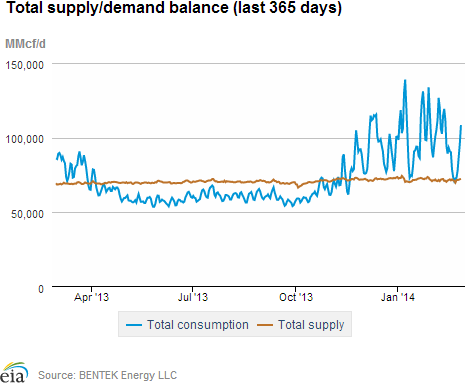
Consumption increases throughout the report week. Consumption increased consistently through the report week as last Thursday's moderate weather became progressively colder. Yesterday was the coldest day of the report week, with total consumption reaching 108.4 Bcf/d. Even so, the average consumption this report week, at 83.7 Bcf/d, was below last week's level by 3.5 Bcf/d (4%).
The largest volumetric drop in consumption came from the residential/commercial sector, which fell week-on-week by 2.1 Bcf/d (4.7%), to 42.6 Bcf/d. Natural gas consumption in the power sector (power burn) fell by a smaller volume but a larger share, decreasing by 1.0 Bcf/d, or 5.9%. Industrial consumption decreased by 0.3 Bcf/d (1.3%), and natural gas exports to Mexico were essentially flat, rising by 0.2%.
Power burn is down in most regions, up in the West. Power burn fell nationally, driven by decreases in the Southeast and Northeast. The Southeast consumed 0.5 Bcf/d (10.3%) less gas for electric generation, followed by the Northeast which consumed 0.4 (11.4%) Bcf/d less gas.
Though nationally this report week was warmer than last, the West Coast saw slightly cooler temperatures on average, particularly in Oregon and Southern California. Power burn in the Southwest increased by 0.1 Bcf/d (4.2%) to an average of 3.1 Bcf/d, and power burn in the Pacific Northwest increased by 0.03 Bcf/d (4.7%) to 0.6 Bcf/d.
Supply is flat on rising production and falling imports. Overall natural gas supply remained essentially flat, increasing by 0.1% over last week. Natural gas dry production rose for the second consecutive week, increasing by 1.0 Bcf/d (1.5%). Dry gas production is currently above year-ago levels by 2.7 Bcf/d (4.3%). Supplies from Canada and from overseas as liquefied natural gas (LNG) decreased for the week, offsetting increases in production, as a 0.8 Bcf/d drop in natural gas imported from Canada and a 0.1 Bcf/d drop in LNG sendout offset the rise in dry production.
Storage
Warmer weather brings a smaller-than-average net withdrawal. The net withdrawal reported for the week ending February 21 was 95 Bcf, 30 Bcf smaller than the 5-year average of 125 Bcf and 70 Bcf smaller than last year's net withdrawal of 165 Bcf. Working gas inventories totaled 1,348 Bcf, 905 Bcf (40.2%) less than last year at this time, 711 Bcf (34.5%) below the 5-year (2009-13) average, and 446 Bcf (24.9%) below the 5-year minimum.
Storage draw falls below market expectations of 105 Bcf. When the EIA storage report was released at 10:30 a.m., the price for the April natural gas futures contract increased 5 cents to $4.54/MMBtu on the New York Mercantile Exchange (Nymex). Prices fell back to $4.51 in the hour following the release.
Net withdrawals in all three regions smaller than average. The East, West, and Producing regions had net withdrawals of 78 Bcf, 12 Bcf, and 5 Bcf, respectively. Storage levels for all three storage regions remain below their year-ago, 5-year average levels, and 5-year minimums.
Temperatures during the storage report week warmer than normal. Temperatures in the Lower 48 states averaged 39.3 degrees for the week, 1.7 degrees warmer than the 30-year normal temperature and 3.4 degrees warmer than during the same period last year.
See also:
| Spot Prices ($/MMBtu) | Thu, 20-Feb |
Fri, 21-Feb |
Mon, 24-Feb |
Tue, 25-Feb |
Wed, 26-Feb |
|---|---|---|---|---|---|
| Henry Hub |
5.94 |
6.22 |
6.18 |
5.25 |
4.84 |
| New York |
6.33 |
7..49 |
10.40 |
19.53 |
24.44 |
| Chicago |
8.70 |
17.58 |
19.41 |
16.66 |
19.95 |
| Cal. Comp. Avg,* |
6.26 |
7.20 |
7.07 |
5.30 |
5.36 |
| Futures ($/MMBtu) | |||||
| March Contract | 6.064 |
6.135 |
5.445 |
5.096 |
4.855 |
| April Contract |
4.856 |
5.012 |
4.620 |
4.691 |
4.541 |
| *Avg. of NGI's reported prices for: Malin, PG&E citygate, and Southern California Border Avg. | |||||
| Source: NGI's Daily Gas Price Index | |||||
| U.S. Natural Gas Supply - Gas Week: (2/19/14 - 2/26/14) | ||
|---|---|---|
Percent change for week compared with: |
||
last year |
last week |
|
| Gross Production | 4.29%
|
1.47%
|
| Dry Production | 4.25%
|
1.46%
|
| Canadian Imports | -13.20%
|
-14.42%
|
| West (Net) | -19.81%
|
-36.39%
|
| MidWest (Net) | 16.91%
|
57.14%
|
| Northeast (Net) | -41.48%
|
-36.06%
|
| LNG Imports | -48.94%
|
-37.07%
|
| Total Supply | 2.64%
|
0.10%
|
| Source: BENTEK Energy LLC | ||
| U.S. Consumption - Gas Week: (2/19/14 - 2/26/14) | ||
|---|---|---|
Percent change for week compared with: |
||
last year |
last week |
|
| U.S. Consumption | -10.5%
|
-4.0%
|
| Power | -25.4%
|
-5.9%
|
| Industrial | -0.5%
|
-1.3%
|
| Residential/Commercial | -8.4%
|
-4.7%
|
| Total Demand | -10.4%
|
-4.0%
|
| Source: BENTEK Energy LLC | ||
| Rigs | |||
|---|---|---|---|
Fri, February 21, 2014 |
Change from |
||
last week |
last year |
||
| Oil Rigs | 1,425 |
0.14% |
7.22% |
| Natural Gas Rigs | 342 |
1.48% |
-20.09% |
| Miscellaneous | 4 |
0.00% |
0.00% |
| Rig Numbers by Type | |||
|---|---|---|---|
Fri, February 21, 2014 |
Change from |
||
last week |
last year |
||
| Vertical | 392 |
3.16% |
-7.55% |
| Horizontal | 1,182 |
-0.08% |
3.68% |
| Directional | 197 |
-1.99% |
0.00% |
| Source: Baker Hughes Inc. | |||
| Working Gas in Underground Storage | ||||
|---|---|---|---|---|
Stocks billion cubic feet (bcf) |
||||
| Region | 2014-02-21 |
2014-02-14 |
change |
|
| East | 607 |
685 |
-78 |
|
| West | 217 |
229 |
-12 |
|
| Producing | 524 |
529 |
-5 |
|
| Total | 1,348 |
1,443 |
-95 |
|
| Source: U.S. Energy Information Administration | ||||
| Working Gas in Underground Storage | |||||
|---|---|---|---|---|---|
Historical Comparisons |
|||||
Year ago (2/21/13) |
5-year average (2009-2013) |
||||
| Region | Stocks (Bcf) |
% change |
Stocks (Bcf) |
% change |
|
| East | 1,015 |
-40.2 |
968 |
-37.3 |
|
| West | 357 |
-39.2 |
316 |
-31.3 |
|
| Producing | 882 |
-40.6 |
775 |
-32.4 |
|
| Total | 2,253 |
-40.2 |
2,059 |
-34.5 |
|
| Source: U.S. Energy Information Administration | |||||
| Temperature -- Heating & Cooling Degree Days (week ending Feb 20) | ||||||||
|---|---|---|---|---|---|---|---|---|
HDD deviation from: |
CDD deviation from: |
|||||||
| Region | HDD Current |
normal |
last year |
CDD Current |
normal |
last year |
||
| New England | 277
|
21
|
31
|
0
|
0
|
0
|
||
| Middle Atlantic | 258
|
16
|
17
|
0
|
0
|
0
|
||
| E N Central | 282
|
20
|
2
|
0
|
0
|
0
|
||
| W N Central | 247
|
-17
|
-37
|
0
|
0
|
0
|
||
| South Atlantic | 146
|
-11
|
-33
|
5
|
-3
|
2
|
||
| E S Central | 133
|
-21
|
-46
|
1
|
0
|
1
|
||
| W S Central | 56
|
-48
|
-52
|
13
|
9
|
13
|
||
| Mountain | 132
|
-65
|
-72
|
4
|
3
|
4
|
||
| Pacific | 65
|
-36
|
-40
|
0
|
0
|
0
|
||
| United States | 183
|
-11
|
-22
|
3
|
1
|
2
|
||
|
Note: HDD = heating degree-day; CDD = cooling degree-day Source: National Oceanic and Atmospheric Administration | ||||||||
Average temperature (°F)
7-Day Mean ending Feb 20, 2014
Source: NOAA/National Weather Service
Deviation between average and normal (°F)
7-Day Mean ending Feb 20, 2014
Source: NOAA/National Weather Service