In the News:
FERC approves service on projects providing almost 1 Bcf/d of gas to New York/New Jersey consumers
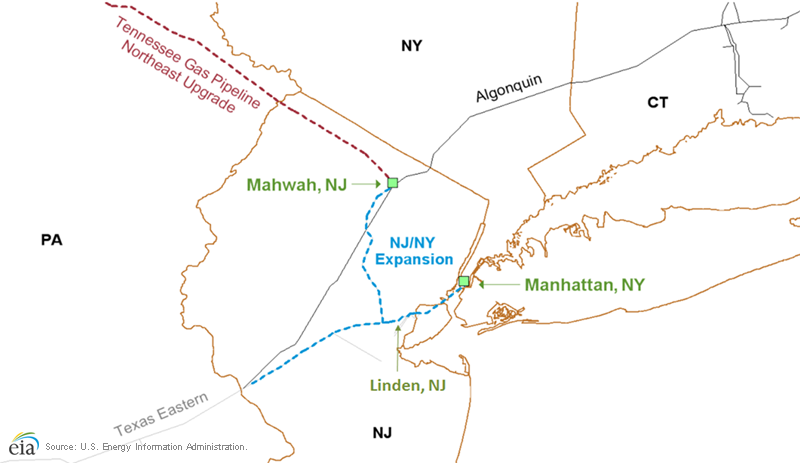
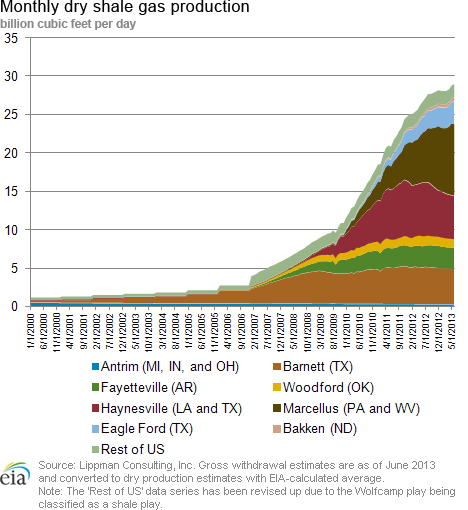
Last week, on October 17, the Federal Energy Regulatory Commission approved the start of service on November 1 of two related projects that would provide almost 1.0 billion cubic feet per day (Bcf/d) of natural gas from the Appalachian Basin's Marcellus Shale play to consumers in the New York/New Jersey region. The projects would take advantage of the significant rise in Marcellus gas production that has taken place over the past two years to increase gas supply to the New York area, where pipeline constraints have led to price spikes during periods of peak winter demand.
The first of these two projects is the New York-New Jersey Expansion project, which would allow for an additional 0.78 Bcf/d of natural gas to be transported along a portion of Spectra Energy's Texas Eastern Transmission Company (TETCO) pipeline, which passes through the Marcellus Shale play to delivery points in Linden, New Jersey, and New York City. TETCO has signed firm transportation agreements for this expansion with Consolidated Edison (0.17 Bcf/d); Chesapeake Energy (0.42 Bcf/d); and Statoil Natural Gas (0.20 Bcf/d). Chesapeake and Statoil will be able to take their combined 0.62 Bcf/d of Marcellus gas to the New York-New Jersey Expansion facilities from the Mahwah, New Jersey, interconnect between Kinder Morgan's Tennessee Gas Pipeline (TGP) and Spectra's Algonquin Gas Transmission (AGT) pipeline. From Mahwah, this gas would flow on AGT to a nearby interconnect with TETCO, which can take it to Linden and New York City.
The second project is TGP's Northeast Upgrade Project. TGP will deliver additional gas to Mahwah along its 300 line from the Marcellus Shale in Bradford County, Pennsylvania, under firm transportation agreements with Chesapeake and Statoil. On October 17, two new compressor stations came on line for this project, with remaining facilities expected for completion by November 1.
Although expansions do occur on AGT facilities, the project design is only focused on supplying additional gas to New York and New Jersey consumers. Thus, this particular project is unlikely to generate a significant increase in AGT's capacity to flow gas beyond New York to New England customers, which have increased their demand for natural gas in recent years.
However, farther north on AGT, gas can flow south to New England customers from points where AGT receives gas imported from Canada via its interconnect with Spectra's Maritimes & Northeast Pipeline in Beverly, Massachusetts, and its interconnect with the Iroquois Pipeline in Brookfield, Connecticut. Maritimes supplies AGT with Canadian LNG and offshore production, and also supplies AGT with inland production from its interconnect in Westbrook, Maine, with the Portland Natural Gas Transmission System (PNGTS) pipeline. Both PNGTS and Iroquois interconnect with pipelines owned by TransCanada, which has received increasing amounts of U.S. gas from its interconnect with TGP in Niagara Falls, New York.
Overview:
(For the Week Ending Wednesday, October 23, 2013)
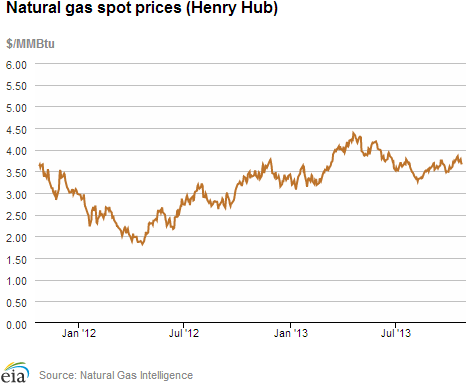
- Natural gas prices decreased across much of the United States over the report week (Wednesday to Wednesday), with the exception of the upper-Midwest and Northeast. The Henry Hub spot price closed yesterday at $3.66 per million British thermal units (MMBtu), down 19 cents per MMBtu from $3.85 per MMBtu at the beginning of the report week.
- At the New York Mercantile Exchange (Nymex), the price of the November 2013 contract decreased by 4% for the report week. The prompt month contract settled at $3.619 yesterday.
- Working natural gas in storage increased to 3,741 Bcf as of Friday, October 18, according to the U.S. Energy Information Administration's (EIA) Weekly Natural Gas Storage Report (WNGSR). A net storage injection of 87 Bcf for the week resulted in storage levels 2.4% below year-ago levels but 2.1% above the 5-year average.
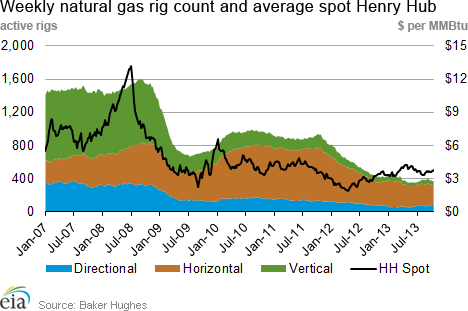
- The Baker Hughes natural gas rotary rig count totaled 372 active units as of Friday, October 18, an increase of 3 rigs from the previous week. The oil rig count decreased by 6 to 1,361. Compared with a year ago, gas rigs were down 55 units while oil rigs were down 49. Total rigs were 1,739, down 100 from a year ago.
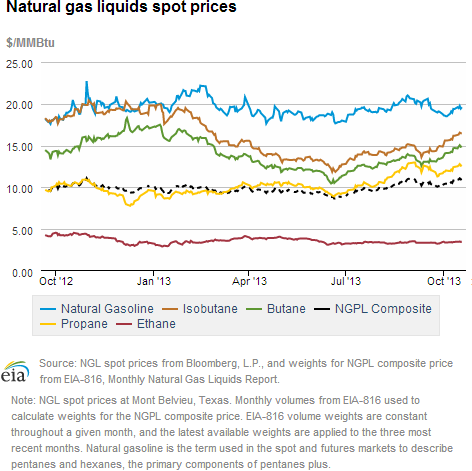
- The weekly average natural gas plant liquids composite price rose this week (covering October 14 through October 18) compared to the previous week by 3.0%, and is now at $10.98 per MMBtu. Natural gas plant liquids prices increased by between 1% and 4%.
Prices/Demand/Supply:
Prices rose in the Midwest and Northeast with seasonally cool weather. As cooler Midwest temperatures started to spread to the Northeast on Monday, the natural gas prices at major trading hubs in those regions recovered most of the previous week's losses by the end of the report week. Moderate temperatures across much of the United States had pushed down natural gas prices by 8 cents to 37 cents per MMBtu from Wednesday to Friday at major natural gas trading hubs. However, with the onset of more seasonably cool weather on Monday, prices rose by 6 cents to 40 cents per MMBtu, particularly in the Northeast. For example, during the Wednesday-to-Friday period, prices at Algonquin Citygate, with delivery into Boston, decreased by 37 cents per MMBtu. In trading on Monday, prices at Algonquin increased 37 cents per MMBtu, and steadily increased through the rest of the report week. In contrast, seasonably warmer temperatures persisted in the West Coast and southern United States and likely contributed to price decreases in those regions.
Prices at the Nymex decreased this week. The November 2013 contract fell from $3.769 per MMBtu last Wednesday to $3.619 yesterday. The price of the 12-month strip (the average of the 12 contracts between November 2013 and October 2013) fell from $3.948 per MMbtu last Wednesday to $3.802 per MMBtu yesterday. As of yesterday, there was no settled price of $5 or more until January 2020. The peak price for this winter was February's $3.82.
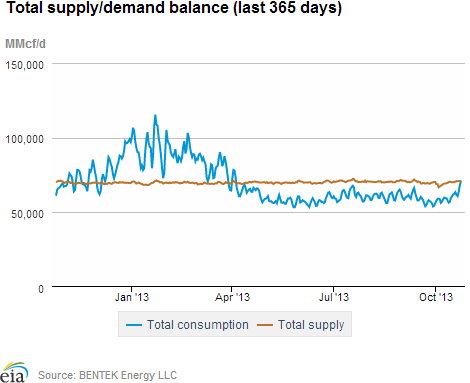
For the first time since April, yesterday's natural gas consumption was greater than natural gas supply. Consumption increased by 9.4% from the previous week, driven by the increase of natural gas consumption in the residential and commercial sectors, according to data from Bentek Energy. Natural gas consumption in the residential and commercial sectors increased by 30.4%, likely due to cooler temperatures in the northern United States. During the report week, natural gas consumption for power generation decreased by 2.7%. Even though power burn in the Midwest and Pacific Northwest increased by 30.5% and 29.4%, respectively, the decrease of power burn in Texas was larger and resulted in the overall decrease of total power burn for the week. U.S. natural gas exports to Mexico and natural gas consumption in the industrial sector increased modestly by 2.6% and 3.3%, respectively.
Natural Gas supply increased during the report week. Total supply increased by 1.1% over the previous week. Dry gas production and imports from Canada increased for the week by 0.2% and 13.6%, respectively. Natural gas imports from Canada in the U.S. West and Midwest accounted for almost all of natural gas imports from Canada. Imports of LNG increased over the report week, but continue to be a small contributor to total U.S. natural gas supply.
Storage
Working natural gas in storage increased to 3,741 Bcf as of Friday, October 18. The 87-Bcf gain in storage levels was significantly larger than the 64-Bcf injection that occurred during the same week in 2012 and larger than the 5-year average increase of 67 Bcf. Current inventories are 92 Bcf (2.4%) less than last year at this time, but 77 Bcf (2.1%) above the 5-year (2008-12) average of 3,664 Bcf.
The net injection was greater than market expectations of 81 Bcf. However, movements on the Nymex upon release of the storage numbers were relatively small. At 10:30 a.m., the price of the near month (November 2013) contract fell about 2 cents to around $3.55 per MMBtu, but rose back up to around $3.59 minutes later. In the hour following the release, prices remained at that level.
Two regions posted larger-than-average builds; East remains below average. Net injections in the East region were 50 Bcf this week, 15 Bcf larger than the 5-year average injection of 35 Bcf. However, stocks remain 3.9% below the 5-year average for that region. Stocks in the West region grew by 4 Bcf, 3 Bcf smaller than the 5-year average injection of 7 Bcf for the region. Inventories in the Producing region grew by 33 Bcf this week, 7 Bcf greater than the 5-year average injection of 26 Bcf, and stocks in that region are 9.3% over their 5-year average levels.
Temperatures during the storage report week were warmer than normal. Temperatures in the Lower 48 states averaged 59.7 degrees for the week, 2.1 degrees warmer than the 30-year normal temperature and 2.6 degrees warmer than the same period last year.
See also:
| Spot Prices ($/MMBtu) | Thu, 17-Oct |
Fri, 18-Oct |
Mon, 21-Oct |
Tue, 22-Oct |
Wed, 23-Oct |
|---|---|---|---|---|---|
| Henry Hub | 3.75 |
3.72 |
3.78 |
3.70 |
3.66 |
| New York | 3.80 |
3.50 |
3.90 |
3.94 |
3.95 |
| Chicago | 3.87 |
3.85 |
4.09 |
3.95 |
3.93 |
| Cal. Comp. Avg,* | 3.88 |
3.83 |
3.95 |
3.87 |
3.87 |
| Futures ($/MMBtu) | |||||
| November Contract | 3.757 |
3.764 |
3.668 |
3.581 |
3.619 |
| December Contract | 3.886 |
3.897 |
3.793 |
3.706 |
3.733 |
| *Avg. of NGI's reported prices for: Malin, PG&E citygate, and Southern California Border Avg. | |||||
| Source: NGI's Daily Gas Price Index | |||||
| Spot Prices ($/MMBtu) | Thu, 10-Oct |
Fri, 11-Oct |
Mon, 14-Oct |
Tue, 15-Oct |
Wed, 16-Oct |
|---|---|---|---|---|---|
| Henry Hub | 3.74 |
3.72 |
3.80 |
3.83 |
3.85 |
| New York | 3.59 |
3.42 |
3.49 |
3.61 |
3.86 |
| Chicago | 3.74 |
3.73 |
3.87 |
3.95 |
3.94 |
| Cal. Comp. Avg,* | 3.83 |
3.80 |
3.93 |
4.01 |
4.03 |
| Futures ($/MMBtu) | |||||
| November Contract | 3.723 |
3.776 |
3.820 |
3.790 |
3.769 |
| December Contract | 3.877 |
3.929 |
3.966 |
3.935 |
3.905 |
| *Avg. of NGI's reported prices for: Malin, PG&E citygate, and Southern California Border Avg. | |||||
| Source: NGI's Daily Gas Price Index | |||||
| U.S. Natural Gas Supply - Gas Week: (10/16/13 - 10/23/13) | ||
|---|---|---|
Percent change for week compared with: |
||
last year |
last week |
|
| Gross Production | 1.93%
|
0.21%
|
| Dry Production | 1.91%
|
0.21%
|
| Canadian Imports | -0.08%
|
13.58%
|
| West (Net) | 13.09%
|
3.40%
|
| MidWest (Net) | 20.02%
|
22.81%
|
| Northeast (Net) | -99.61%
|
-106.51%
|
| LNG Imports | -47.79%
|
5.11%
|
| Total Supply | 1.50%
|
1.07%
|
| Source: BENTEK Energy LLC | ||
| U.S. Consumption - Gas Week: (10/16/13 - 10/23/13) | ||
|---|---|---|
Percent change for week compared with: |
||
last year |
last week |
|
| U.S. Consumption | 6.77%
|
9.40%
|
| Power | -5.64%
|
-2.66%
|
| Industrial | 2.98%
|
3.34%
|
| Residential/Commercial | 25.39%
|
30.42%
|
| Total Demand | 5.82%
|
9.24%
|
| Source: BENTEK Energy LLC | ||
| Rigs | |||
|---|---|---|---|
Fri, October 18, 2013 |
Change from |
||
last week |
last year |
||
| Oil Rigs | 1,361 |
-0.44% |
-3.48% |
| Natural Gas Rigs | 372 |
0.81% |
-12.88% |
| Miscellaneous | 6 |
-14.29% |
200.00% |
| Rig Numbers by Type | |||
|---|---|---|---|
Fri, October 18, 2013 |
Change from |
||
last week |
last year |
||
| Vertical | 401 |
-1.96% |
-23.62% |
| Horizontal | 1,099 |
-0.63% |
-1.35% |
| Directional | 239 |
4.82% |
19.50% |
| Source: Baker Hughes Inc. | |||
| Working Gas in Underground Storage | ||||
|---|---|---|---|---|
Stocks billion cubic feet (bcf) |
||||
| Region | 10/18/13
|
10/11/13
|
change |
|
| East | 1,947 |
1,897 |
50
|
|
| West | 549 |
545 |
4
|
|
| Producing | 1,245 |
1,212 |
33
|
|
| Total | 3,741 |
3,654 |
87
|
|
| Source: U.S. Energy Information Administration | ||||
| Working Gas in Underground Storage | |||||
|---|---|---|---|---|---|
Historical Comparisons |
|||||
Year ago (10/18/12) |
5-year average (2008-2012) |
||||
| Region | Stocks (Bcf) |
% change |
Stocks (Bcf) |
% change |
|
| East | 2,053 |
-5.2 |
2,027 |
-3.9 |
|
| West | 530 |
3.6 |
498 |
10.2 |
|
| Producing | 1,250 |
-0.4 |
1,139 |
9.3 |
|
| Total | 3,833 |
-2.4 |
3,664 |
2.1 |
|
| Source: U.S. Energy Information Administration | |||||
| Temperature -- Heating & Cooling Degree Days (week ending Oct 17) | ||||||||
|---|---|---|---|---|---|---|---|---|
HDD deviation from: |
CDD deviation from: |
|||||||
| Region | HDD Current |
normal |
last year |
CDD Current |
normal |
last year |
||
| New England | 69
|
-28
|
-28
|
0
|
0
|
0
|
||
| Middle Atlantic | 40
|
-46
|
-52
|
0
|
-1
|
0
|
||
| E N Central | 70
|
-20
|
-37
|
0
|
-2
|
0
|
||
| W N Central | 89
|
1
|
-6
|
0
|
-2
|
0
|
||
| South Atlantic | 19
|
-27
|
-30
|
27
|
-1
|
0
|
||
| E S Central | 17
|
-28
|
-29
|
15
|
3
|
6
|
||
| W S Central | 13
|
-3
|
3
|
46
|
15
|
-4
|
||
| Mountain | 108
|
22
|
41
|
5
|
-8
|
-7
|
||
| Pacific | 27
|
-5
|
-3
|
1
|
-8
|
-8
|
||
| United States | 49
|
-16
|
-20
|
12
|
-1
|
-2
|
||
|
Note: HDD = heating degree-day; CDD = cooling degree-day Source: National Oceanic and Atmospheric Administration | ||||||||
Average temperature (°F)
7-Day Mean ending Oct 17, 2013
Source: NOAA/National Weather Service
Deviation between average and normal (°F)
7-Day Mean ending Oct 17, 2013
Source: NOAA/National Weather Service