In the News:
Low Natural Gas Prices Drive Industrial Natural Gas Consumption
Industrial consumption of natural gas is poised to continue recent growth through the next several years, evidenced by planned expansions in gas-intensive industries, as well as by a major industrial indicator released this week by the Institute for Supply Management.
Indicating an uptick in industrial activity, the recently released PMI (formerly the Purchasing Manager's Index) for August registered 55.7, the highest level in more than two years. The PMI is an indicator of whether manufacturers feel that business conditions are improving, staying the same, or worsening each month. An index of 50 indicates that business managers believe market conditions are unchanged, while an index of greater than 50 indicates a positive outlook.
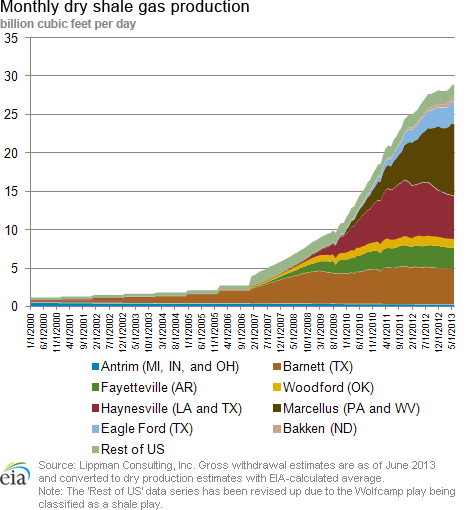
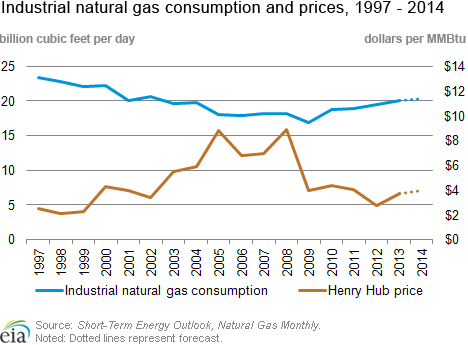
Industrial consumption of natural gas declined through the 2000s, consistent with a general increase in natural gas prices. Consumption bottomed out at 16.9 billion cubic feet per day (Bcf/d) in 2009, and since then, has been slowly increasing in response to relatively low natural gas prices and abundant shale gas production. U.S. Energy Information Administration's (EIA) August Short-Term Energy Outlook projects moderate growth in industrial consumption through its forecast period, which extends through December 2014. However, many natural-gas intensive projects are planned to come online in 2015 or later, which will provide potential for rapid growth in the sector beginning in 2015.
Ammonia-based fertilizer and methanol plants use natural gas directly as a feedstock and are thus among the most natural gas-intensive industrial end users. Low gas prices and proximity to shale resources have led to proposals for several methanol plants in the southeastern United States. In a recent report, Bentek Energy estimated that most of the proposed methanol plants will each consume between 0.1 and 0.15 Bcf/d. While most proposed methanol facilities are planned for 2015-17, chemical company Lyondell Basell expects to restart a formerly shuttered plant in Channelview, Texas, later this year. Two other plants are expected to be operational in 2014, which will increase methanol production by more than 50%; one is currently under construction in Texas, and another is being moved to Louisiana from Chile. Several ammonia and fertilizer plants, also very natural gas-intensive, are in the planning or construction stages for the coming years. In addition, demand for natural gas-fueled heat and power will continue to grow along with continued steady growth in other basic commodity chemicals production.
In recent years, the electricity generation sector has overtaken industrial plants as the largest natural-gas consuming sector. While demand for natural gas is highly price-sensitive in the electric power sector, the industrial sector is slower to respond to changes in price. Many industrial plants can increase marginal production relatively quickly, but they often have limited flexibility when choosing fuel energy and feedstock sources. New petrochemical or manufacturing plants are capital-intensive and take several years to come on line.
Overview:
(For the Week Ending Wednesday, September 4, 2013)
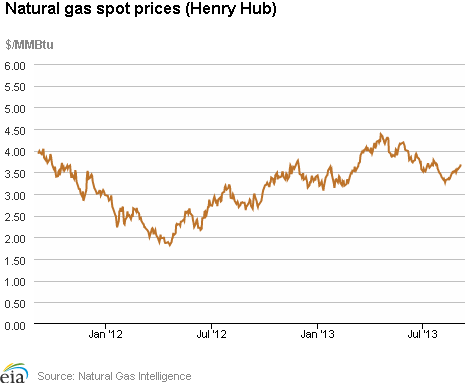
- Nationwide natural gas hub prices grew moderately over the report week (Wednesday to Wednesday), which included the Labor Day holiday. The Henry Hub spot price closed yesterday at $3.68 per million British thermal units (MMBtu), up 14 cents per MMBtu from the beginning of the report week.
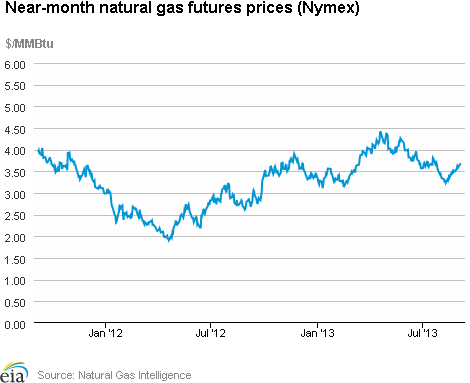
- At the New York Mercantile Exchange (Nymex), the price of the October 2013 contract increased 10.1 cents, from $3.582 per MMBtu last Wednesday to $3.683 yesterday.
- Working natural gas in storage increased to 3,188 Bcf as of Friday, August 30, according to the EIA's Weekly Natural Gas Storage Report (WNGSR). A net storage injection of 58 Bcf for the week resulted in storage levels 6.2% below year-ago levels and 1.4% above the 5-year average.
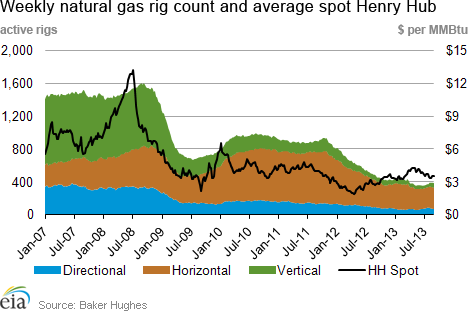
- The Baker Hughes natural gas rotary rig count totaled 380 active units as of Friday, August 30, a decrease of 7 rigs from the previous week. The oil rig count increased by 6 to 1,388. Compared with a year ago, gas rigs are down 93 units while oil rigs are down 31.
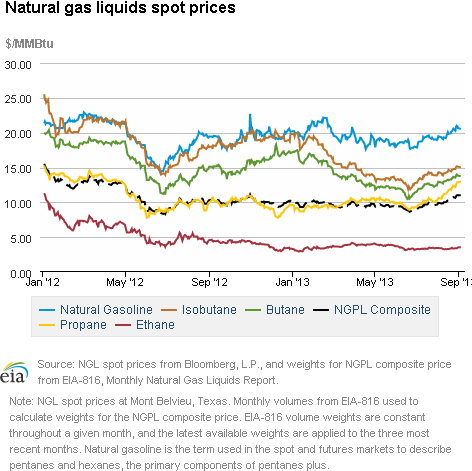
- The weekly average natural gas plant liquids composite price rose this week (covering August 26 through 30) compared to the previous week by 3.2%, and is now at $10.90 per MMBtu. Natural gas plant liquids prices increased by between 2% and 5%, except for ethane, which increased by just 1.1%.
Prices/Demand/Supply:
Natural gas hub prices were moderately higher over the report week. Prices at most locations increased 10 to 20 cents per MMBtu from Wednesday-to-Wednesday of the report week. Prices in the Marcellus, however, were lower over the report week, likely due to transportation constraints associated with moving gas out of that producing area. Prices declined by more than $1.00 per MMBtu over Thursday and Friday at those trading locations; for example, prices at the Transcontinental Leidy trading point in Pennsylvania closed Friday $1.34 per MMBtu lower than on the preceding Wednesday. Prices in the Marcellus rose somewhat in Tuesday and Wednesday trading, with the Transcontinental Leidy point ending the report week down 66 cents compared with the previous Wednesday.
Prices at the Henry Hub increased modestly. The Henry Hub spot price, which started the report week at $3.54 per MMBtu, posted single digit gains in trading on Thursday, Tuesday, and Wednesday and a single digit loss on Friday. The Henry Hub price ended the report week at $3.68 per MMBtu, up 14 cents per MMBtu from the previous Wednesday. Similarly, at the Nymex, the October natural gas contract, which moved into the near-month position Thursday, increased 10.1 cents per MMBtu from $3.582 per MMBtu last Wednesday to $3.683 per MMBtu yesterday. The 12-Month Strip (average of October 2013 to September 2014 contracts) gained 8.7 cents per MMBtu for the week, closing at $3.908 per MMBtu.
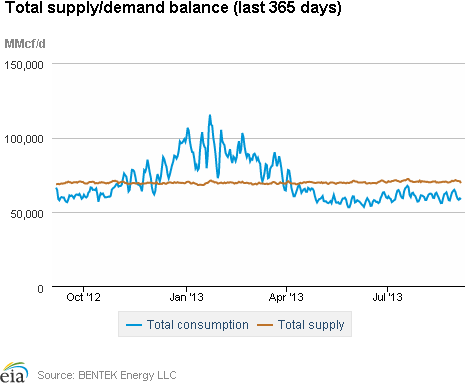
Falling power sector demand for natural gas resulted in a total gas consumption decrease of 0.8% compared with the previous report week. Consumption of natural gas for power generation (power burn) decreased 1.3% from the previous week, according to Bentek Energy data. The Midwest region registered a week-over-week decline of 34.3%. This more than offset increases in power burn in the Rockies, Southwest and Southeast. Residential and commercial consumption increased 1.3%, and industrial consumption increased 0.2%. U.S. pipeline exports to Mexico fell 12.3% but are still 4.1% higher than this week last year.
Gas supply increased slightly during the report week. Total supply increased by 0.6% over the previous week. Dry gas production and imports from Canada rose week-on-week, by 0.4% and 1.1%, respectively. Imports from Canada increased in the Midwest and Northeast, but decreased in the West. Imports of LNG also increased over the report week, but continue to be a small contributor to total U.S. natural gas supply.
Storage
Working natural gas in storage increased to 3,188 Bcf as of Friday, August 30, according to EIA's WNGSR. The 58-Bcf gain in storage levels was significantly higher than the 33-Bcf injection that occurred during the same week in 2012, but was in line with the 5-year average increase of 60 Bcf. Current inventories are 210 Bcf (6.2%) less than last year at this time and 43 Bcf (1.4%) above the 5-year average of 3,145 Bcf.
The net injection was larger than market expectations, which on average were reported to be around 54 Bcf. The larger-than-expected build contributed to natural gas prompt-month Nymex futures prices decreasing by about 8 cents per MMBtu to just around $3.61 per MMBtu immediately following WNGSR's release. In the hour following the release, prices remained around that level.
With a lower than average build, the East region remains the only region below its 5-year average storage level. The East region was also the only region that had a stock build lower than the 5-year average with net injections in the East region growing by 43 Bcf, 8 Bcf lower than its 5-year average injections of 51 Bcf.
This week's close-to-average net injection occurred despite modestly higher-than-normal temperatures during the storage report week. Temperatures in the Lower 48 states averaged 3.1 degrees warmer than the 30-year normal temperature and 1.0 degree warmer than the same period last year, and averaged 75.4 degrees for the week, compared to the 30-year normal of 72.3 degrees and 74.4 degrees last year.
See also:
| Spot Prices ($/MMBtu) | Thu, 29-Aug |
Fri, 30-Aug |
Mon, 2-Sep |
Tue, 3-Sep |
Wed, 4-Sep |
|---|---|---|---|---|---|
| Henry Hub | 3.58 |
3.57 |
Holiday |
3.64 |
3.68 |
| New York | 3.62 |
3.66 |
Holiday |
3.79 |
3.77 |
| Chicago | 3.72 |
3.64 |
Holiday |
3.80 |
3.82 |
| Cal. Comp. Avg,* | 3.77 |
3.77 |
Holiday |
3.90 |
3.92 |
| Futures ($/MMBtu) | |||||
| October Contract | 3.618 |
3.581 |
Holiday |
3.666 |
3.683 |
| November Contract | 3.720 |
3.684 |
Holiday |
3.760 |
3.767 |
| *Avg. of NGI's reported prices for: Malin, PG&E citygate, and Southern California Border Avg. | |||||
| Source: NGI's Daily Gas Price Index | |||||
| U.S. Natural Gas Supply - Gas Week: (8/28/13 - 9/4/13) | ||
|---|---|---|
Percent change for week compared with: |
||
last year |
last week |
|
| Gross Production | 7.33%
|
0.43%
|
| Dry Production | 7.26%
|
0.42%
|
| Canadian Imports | -9.17%
|
1.06%
|
| West (Net) | 15.21%
|
-1.63%
|
| MidWest (Net) | -10.78%
|
3.35%
|
| Northeast (Net) | -93.01%
|
336.90%
|
| LNG Imports | -4.41%
|
29.23%
|
| Total Supply | 5.77%
|
0.60%
|
| Source: BENTEK Energy LLC | ||
| U.S. Consumption - Gas Week: (8/28/13 - 9/4/13) | ||
|---|---|---|
Percent change for week compared with: |
||
last year |
last week |
|
| U.S. Consumption | -5.45%
|
-0.40%
|
| Power | -11.43%
|
-1.32%
|
| Industrial | -0.23%
|
0.17%
|
| Residential/Commercial | 5.02%
|
1.32%
|
| Total Demand | -5.18%
|
-0.82%
|
| Source: BENTEK Energy LLC | ||
| Rigs | |||
|---|---|---|---|
Fri, August 30, 2013 |
Change from |
||
last week |
last year |
||
| Oil Rigs | 1,388 |
0.43% |
-2.18% |
| Natural Gas Rigs | 380 |
-1.81% |
-19.66% |
| Miscellaneous | 8 |
14.29% |
300.00% |
| Rig Numbers by Type | |||
|---|---|---|---|
Fri, August 30, 2013 |
Change from |
||
last week |
last year |
||
| Vertical | 450 |
1.12% |
-14.45% |
| Horizontal | 1,078 |
0.28% |
-6.18% |
| Directional | 248 |
-3.13% |
13.24% |
| Source: Baker Hughes Inc. | |||
| Working Gas in Underground Storage | ||||
|---|---|---|---|---|
Stocks billion cubic feet (bcf) |
||||
| Region | 8/30/13
|
8/23/13
|
change |
|
| East | 1,598 |
1,555 |
43
|
|
| West | 505 |
502 |
3
|
|
| Producing | 1,085 |
1,073 |
12
|
|
| Total | 3,188 |
3,130 |
58
|
|
| Source: U.S. Energy Information Administration | ||||
| Working Gas in Underground Storage | |||||
|---|---|---|---|---|---|
Historical Comparisons |
|||||
Year ago (8/30/12) |
5-year average (2008-2012) |
||||
| Region | Stocks (Bcf) |
% change |
Stocks (Bcf) |
% change |
|
| East | 1,788 |
-10.6 |
1,713 |
-6.7 |
|
| West | 492 |
2.6 |
447 |
13.0 |
|
| Producing | 1,118 |
-3.0 |
985 |
10.2 |
|
| Total | 3,398 |
-6.2 |
3,145 |
1.4 |
|
| Source: U.S. Energy Information Administration | |||||
| Temperature -- Heating & Cooling Degree Days (week ending Aug 29) | ||||||||
|---|---|---|---|---|---|---|---|---|
HDD deviation from: |
CDD deviation from: |
|||||||
| Region | HDD Current |
normal |
last year |
CDD Current |
normal |
last year |
||
| New England | 2
|
-5
|
1
|
34
|
11
|
-3
|
||
| Middle Atlantic | 1
|
-3
|
0
|
48
|
12
|
-9
|
||
| E N Central | 0
|
-7
|
-1
|
64
|
29
|
8
|
||
| W N Central | 0
|
-11
|
0
|
94
|
47
|
30
|
||
| South Atlantic | 0
|
-1
|
0
|
82
|
0
|
3
|
||
| E S Central | 0
|
-1
|
0
|
84
|
7
|
8
|
||
| W S Central | 0
|
0
|
0
|
122
|
10
|
9
|
||
| Mountain | 0
|
-14
|
-1
|
72
|
10
|
2
|
||
| Pacific | 0
|
-6
|
-3
|
56
|
15
|
10
|
||
| United States | 0
|
-6
|
-1
|
73
|
16
|
6
|
||
|
Note: HDD = heating degree-day; CDD = cooling degree-day Source: National Oceanic and Atmospheric Administration | ||||||||
Average temperature (°F)
7-Day Mean ending Aug 29, 2013
Source: NOAA/National Weather Service
Deviation between average and normal (°F)
7-Day Mean ending Aug 29, 2013
Source: NOAA/National Weather Service