In the News:
EIA forecasts continued growth in Lower 48 onshore natural gas production through 2014.
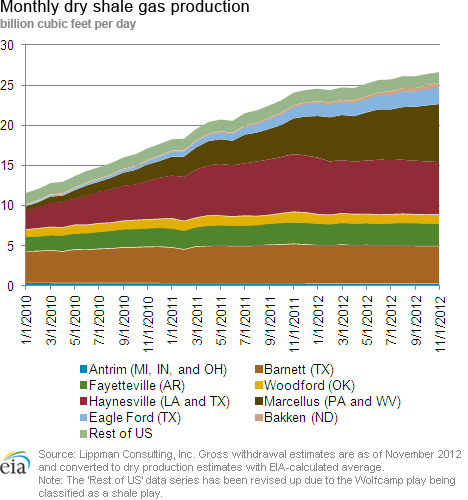
EIA's January Short-Term Energy Outlook (STEO), released on January 7, now includes EIA's forecast of energy consumption, supply, and prices through 2014. STEO expects continued growth in natural gas production, driven largely by onshore production in shale areas. In particular, production in the Marcellus Shale areas of Pennsylvania and West Virginia is expected to continue rising, as recently drilled wells become operational. Despite relatively low natural gas prices, Pennsylvania drilling continues at a strong pace as producers target combination oil-and-gas wells.
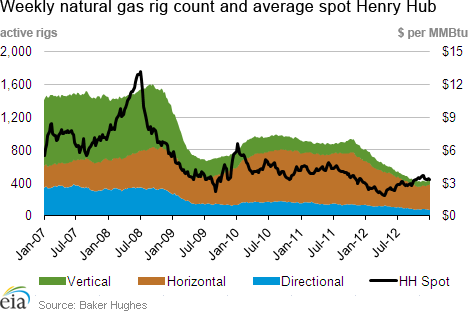
Production has been rising despite large decreases in the natural gas rig count over the past year. According to Baker Hughes, the natural gas rig count was 431 as of December 28, 2012, compared with 811 at the start of 2012. The oil rig count has also declined in recent months (oil rigs often produce associated natural gas), although declines have been much smaller than declines in the natural gas rig count. The declines in rig counts, coupled with continued production growth, suggest increases in rig efficiency, which will maintain production levels going forward.
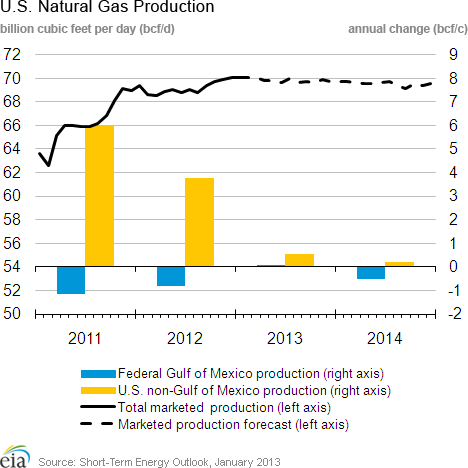
This month's STEO expects that total marketed production will increase from 69.2 Bcf/d in 2012 to 69.8 Bcf/d in 2013, and drop slightly to 69.5 Bcf/d in 2014. EIA expects growth in Lower 48 onshore production will continue through 2014, and will be offset by Gulf of Mexico declines next year.
Overview:
(For the Week Ending Wednesday, January 9, 2013)
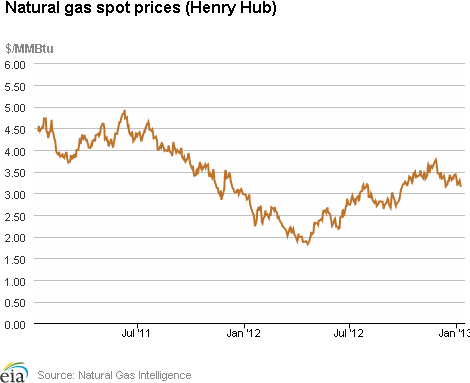
- At most market locations, natural gas prices fell during the report week (Wednesday, January 2 to Wednesday, January 9). The Henry Hub spot price fell from $3.30 per million Btu (MMBtu) last Wednesday to $3.14 per MMBtu yesterday.
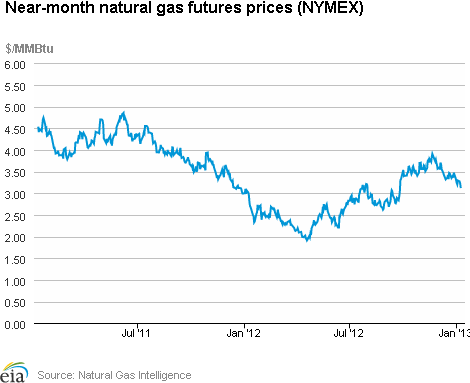
- The near-month (February 2013) NYMEX futures contract declined 12 cents per MMBtu over the report week, from $3.233 per MMBtu last Wednesday to $3.113 per MMBtu yesterday.
- Working natural gas in storage declined last week to 3,316 billion cubic feet (Bcf) as of Friday, January 4, according to the U.S. Energy Information Administration's (EIA) Weekly Natural Gas Storage Report (WNGSR). An implied storage net withdrawal of 201 Bcf for the week positioned storage volumes 88 Bcf below year-ago levels.
- The natural gas rotary rig count, as reported by Baker Hughes Incorporated on January 4, rose to 439, an increase of 8 rigs from the previous week. The oil rig count fell by 9 rigs to 1318.
Prices:
Natural gas prices fell over the last week, continuing an overall downward trend from the past few weeks. The Henry Hub spot price fell 16 cents per MMBtu from $3.30 per MMBtu last week to $3.14 per MMBtu yesterday. Prices declined similarly in most other areas of the country, and most prices are in the $3 per MMBtu range.
The Northeast posted the largest declines in prices this week. A cold snap that occurred at the end of December and lasted into the beginning of January sent prices in New York and New England above $15 per MMBtu. On December 31, prices at Transcontinental Pipeline's Zone 6 trading point for delivery into New York City averaged $16.74 per MMBtu; at the Algonquin Citygate, which serves Boston, prices averaged $15.27 per MMBtu. By January 2 (the beginning of this report week) prices at both these locations fell back to around $10 per MMBtu. At the end of the report week, the Transco Zone 6 New York price fell to $3.33 per MMBtu and the Algonquin Citygate price fell to $4.41 per MMBtu. Pricing points in the Northeast often spike during periods of high demand in the winter as a result of pipeline constraints.
Relatively low demand during the month of December and the beginning of January contributed to the low prices. December 2012 was the 10th warmest on record, according to recent NOAA reports, with seasonally warm temperatures particularly east of the Rocky Mountains. Temperatures in December averaged 36.4 degrees nationwide, 3.4 degrees greater than the long-term average. Mild weather has persisted into January as well. The warm December was evident in the weekly natural gas storage withdrawal; the five-year average (2007-2011) withdrawals for December 2012 are all over 100 Bcf. A triple digit withdrawal did not occur until the week ending December 28, 2012; additionally, the WNGSR reported a net injection of 2 Bcf for the week ending December 7, 2012. While this is not unprecedented, there are only two other net injections in December on record (1998 and 2005).
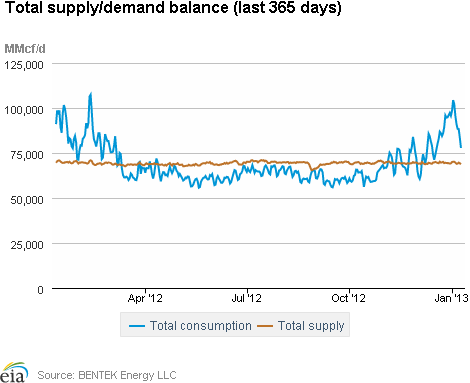
Both natural gas supply and consumption fell during the report week. According to data from Bentek Energy LLC, total supply fell by 0.2 percent, with a 0.4 percent decline in dry production. LNG sendout and pipeline imports from Canada increased during the week. Supply is down 1.5 percent from the same time last year. Consumption fell 8.0 percent this week, with a 12.8 percent decline in residential and commercial natural gas consumption. Residential and commercial consumption, however, was 14.4 percent greater than this time last year, although last winter was one of the warmest on record. Use of natural gas for power generation and industrial consumption also fell this week.
The NYMEX near-month (February 2013) natural gas contract fell 12 cents per MMBtu during the report week to $3.113 per MMBtu. During its tenure as the near-month contract, the February contract fell 35.6 cents per MMBtu. Last year, the February 2012 contract remained below $3 per MMBtu during most of its time in the near-month position. The 12-month strip (the average of the contracts from February 2013 through March 2014) for this report week lost a little more than 10 cents per MMBtu, falling from $3.504 per MMBtu last Wednesday to $3.403 per MMBtu yesterday.
Storage
Working natural gas in storage decreased to 3,316 Bcf as of Friday, January 4, according to EIA's WNGSR. This represents an implied net withdrawal of 201 Bcf from the previous week, the largest withdrawal for this heating season. This week's net withdrawal was 69 Bcf larger than the 5-year average net withdrawal of 132 Bcf, and 111 Bcf larger than last year's net withdrawal of 90 Bcf. Inventories are currently 88 Bcf (2.6 percent) less than last year at this time and 320 Bcf (10.7 percent) greater than the 5-year average.
All three storage regions posted declines this week. Inventories in the East, West, and Producing regions decreased by 113 Bcf (the 5-year average net withdrawal is 84 Bcf), 27 Bcf (the 5-year average net withdrawal is 17 Bcf), and 61 Bcf (the 5-year average net withdrawal is 31 Bcf), respectively. In the Producing region, working natural gas inventories decreased 19 Bcf (6.3 percent) in salt cavern facilities and decreased 41 Bcf (4.5 percent) in nonsalt cavern facilities.
Temperatures during the storage report week were 2.4 degrees cooler than the 30-year normal temperature and 9.1 degrees cooler than the same period last year. Temperatures in the Lower 48 states averaged 31.3 degrees, compared to 40.4 degrees last year and the 30-year normal of 33.7 degrees. During the week all regions with the exception of the South Atlantic Census division were cooler than normal. The South Atlantic Census division averaged a little (0.1 degrees) above the 30-year normal. The Mountain and Pacific Census divisions in the West were particularly cool, averaging 7.3 and 5.0 degrees cooler, respectively, than the 30-year normal. Heating degree-days nationwide were 7.7 percent above normal and 37.0 percent above last year.
See also:
| Spot Prices ($/MMBtu) | Thu, 3-Jan |
Fri, 4-Jan |
Mon, 7-Jan |
Tue, 8-Jan |
Wed, 9-Jan |
|---|---|---|---|---|---|
| Henry Hub | 3.19 |
3.20 |
3.29 |
3.21 |
3.14 |
| New York | 6.01 |
4.82 |
4.35 |
3.42 |
3.33 |
| Chicago | 3.24 |
3.28 |
3.38 |
3.30 |
3.23 |
| Cal. Comp. Avg,* | 3.38 |
3.41 |
3.53 |
3.45 |
3.38 |
| Futures ($/MMBtu) | |||||
| February Contract | 3.200 |
3.290 |
3.266 |
3.218 |
3.113 |
| March Contract | 3.210 |
3.300 |
3.281 |
3.234 |
3.131 |
| *Avg. of NGI's reported prices for: Malin, PG&E citygate, and Southern California Border Avg. | |||||
| Source: NGI's Daily Gas Price Index | |||||
| Spot Prices ($/MMBtu) | Thu, 27-Dec |
Fri, 28-Dec |
Mon, 31-Dec |
Tue, 1-Jan |
Wed, 2-Jan |
|---|---|---|---|---|---|
| Henry Hub | 3.31 |
3.40 |
3.43 |
Holiday |
3.30 |
| New York | 6.24 |
10.69 |
16.74 |
Holiday |
9.75 |
| Chicago | 3.41 |
3.49 |
3.58 |
Holiday |
3.41 |
| Cal. Comp. Avg,* | 3.53 |
3.56 |
3.57 |
Holiday |
3.48 |
| Futures ($/MMBtu) | |||||
| January Contract | 3.354 |
Expired |
Expired |
Holiday |
Expired |
| February Contract | 3.412 |
3.469 |
3.351 |
Holiday |
3.233 |
| March Contract | -- |
3.482 |
3.365 |
Holiday |
3.255 |
| *Avg. of NGI's reported prices for: Malin, PG&E citygate, and Southern California Border Avg. | |||||
| Source: NGI's Daily Gas Price Index | |||||
| Spot Prices ($/MMBtu) | Thu, 20-Dec |
Fri, 21-Dec |
Mon, 24-Dec |
Tue, 25-Dec |
Wed, 26-Dec |
|---|---|---|---|---|---|
| Henry Hub | 3.34 |
3.42 |
3.30 |
Holiday |
3.35 |
| New York | 3.63 |
4.09 |
3.98 |
Holiday |
4.32 |
| Chicago | 3.49 |
3.50 |
3.39 |
Holiday |
3.46 |
| Cal. Comp. Avg,* | 3.58 |
3.68 |
3.53 |
Holiday |
3.58 |
| Futures ($/MMBtu) | |||||
| January Contract | 3.462 |
3.451 |
3.346 |
Holiday |
3.392 |
| February Contract | 3.495 |
3.482 |
3.378 |
Holiday |
3.425 |
| *Avg. of NGI's reported prices for: Malin, PG&E citygate, and Southern California Border Avg. | |||||
| Source: NGI's Daily Gas Price Index | |||||
| U.S. Natural Gas Supply - Gas Week: (1/2/13 - 1/9/13) | ||
|---|---|---|
Percent change for week compared with: |
||
last year |
last week |
|
| Gross Production | -1.07%
|
-0.38%
|
| Dry Production | -1.06%
|
-0.38%
|
| Canadian Imports | 2.06%
|
1.13%
|
| West (Net) | -1.25%
|
4.61%
|
| MidWest (Net) | 19.46%
|
1.86%
|
| Northeast (Net) | -5.33%
|
-4.03%
|
| LNG Imports | -61.65%
|
9.55%
|
| Total Supply | -1.51%
|
-0.22%
|
| Source: BENTEK Energy LLC | ||
| U.S. Consumption - Gas Week: (1/2/13 - 1/9/13) | ||
|---|---|---|
Percent change for week compared with: |
||
last year |
last week |
|
| U.S. Consumption | 8.22%
|
-8.14%
|
| Power | 2.81%
|
-3.38%
|
| Industrial | 1.20%
|
-1.41%
|
| Residential/Commercial | 14.40%
|
-12.78%
|
| Total Demand | 8.55%
|
-7.98%
|
| Source: BENTEK Energy LLC | ||
| Rigs | |||
|---|---|---|---|
Fri, January 04, 2013 |
Change from |
||
last week |
last year |
||
| Oil Rigs | 1,318 |
-0.68% |
10.66% |
| Natural Gas Rigs | 439 |
1.86% |
-45.87% |
| Miscellaneous | 5 |
0.00% |
0.00% |
| Rig Numbers by Type | |||
|---|---|---|---|
Fri, January 04, 2013 |
Change from |
||
last week |
last year |
||
| Vertical | 480 |
0.63% |
-23.93% |
| Horizontal | 1,112 |
0.09% |
-4.14% |
| Directional | 170 |
-2.86% |
-21.30% |
| Source: Baker Hughes Inc. | |||
| Working Gas in Underground Storage | ||||
|---|---|---|---|---|
Stocks billion cubic feet (bcf) |
||||
| Region | 1/4/13
|
12/28/12
|
change |
|
| East | 1,686 |
1,799 |
-113
|
|
| West | 478 |
505 |
-27
|
|
| Producing | 1,152 |
1,213 |
-61
|
|
| Total | 3,316 |
3,517 |
-201
|
|
| Source: U.S. Energy Information Administration | ||||
| Working Gas in Underground Storage | |||||
|---|---|---|---|---|---|
Historical Comparisons |
|||||
Year ago (1/4/12) |
5-year average (2008-2012) |
||||
| Region | Stocks (Bcf) |
% change |
Stocks (Bcf) |
% change |
|
| East | 1,776 |
-5.1 |
1,593 |
5.8 |
|
| West | 445 |
7.4 |
407 |
17.4 |
|
| Producing | 1,184 |
-2.7 |
996 |
15.7 |
|
| Total | 3,404 |
-2.6 |
2,996 |
10.7 |
|
| Source: U.S. Energy Information Administration | |||||
| Temperature -- Heating & Cooling Degree Days (week ending Jan 03) | ||||||||
|---|---|---|---|---|---|---|---|---|
HDD deviation from: |
CDD deviation from: |
|||||||
| Region | HDD Current |
normal |
last year |
CDD Current |
normal |
last year |
||
| New England | 279
|
15
|
67
|
0
|
0
|
0
|
||
| Middle Atlantic | 254
|
2
|
44
|
0
|
0
|
0
|
||
| E N Central | 292
|
6
|
60
|
0
|
0
|
0
|
||
| W N Central | 325
|
15
|
101
|
0
|
0
|
0
|
||
| South Atlantic | 175
|
-3
|
19
|
5
|
-2
|
2
|
||
| E S Central | 198
|
14
|
42
|
0
|
-1
|
0
|
||
| W S Central | 167
|
29
|
60
|
0
|
-2
|
0
|
||
| Mountain | 287
|
51
|
110
|
0
|
0
|
0
|
||
| Pacific | 161
|
35
|
83
|
0
|
0
|
0
|
||
| United States | 237
|
17
|
64
|
1
|
0
|
0
|
||
|
Note: HDD = heating degree-day; CDD = cooling degree-day Source: National Oceanic and Atmospheric Administration | ||||||||
Average temperature (°F)
7-Day Mean ending Jan 03, 2013
Source: NOAA/National Weather Service
Deviation between average and normal (°F)
7-Day Mean ending Jan 03, 2013
Source: NOAA/National Weather Service