In the News:
Although Storage Injections Are Below Historical Levels, Inventories Remain High
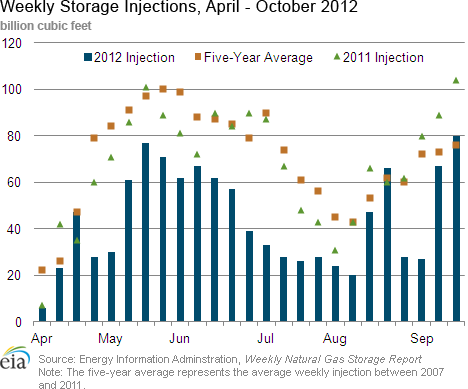
Working natural gas levels as of September 21 were at 3,576 Bcf, representing an implied net injection of 80 Bcf from the previous week, the highest storage build of the 2012 injection season.
This injection season, additions to working natural gas inventories have been below the five-year (2007-2011) average injections as well as below last year's injection levels, for all but three weeks, including the most current week. Despite lower injections, overall inventory levels remain at historical highs and are expected to hit a new record at the end of October, when the traditional injection season ends. The U.S. Energy Information Administration's (EIA) Short-Term Energy Outlook (STEO) expects that inventory levels will end the heating season at 3,950 billion cubic feet (Bcf), a new end-of-October record. The STEO projects record high levels despite the low injections this season because inventories began the season at a very high level.
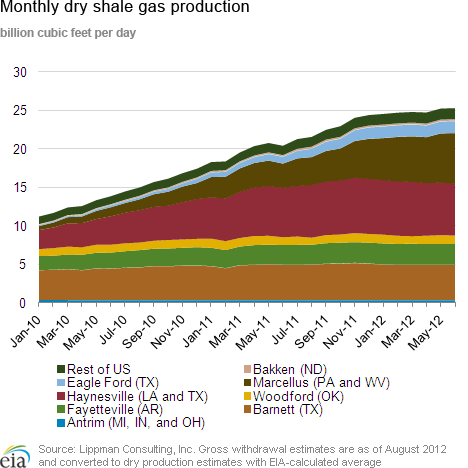
This injection season began with 2,477 Bcf of working natural gas in storage, coming out of a warm winter that required low withdrawals to meet depressed heating demand. (In 2011, the injection season began with 1,581 Bcf in storage.) While EIA expects inventory levels will end the injection season at a record high, the projected increase of 1,473 Bcf in working gas inventory during the 2012 injection season would be the smallest build since 1991.
Overview:
(For the Week Ending Wednesday, September 26, 2012)
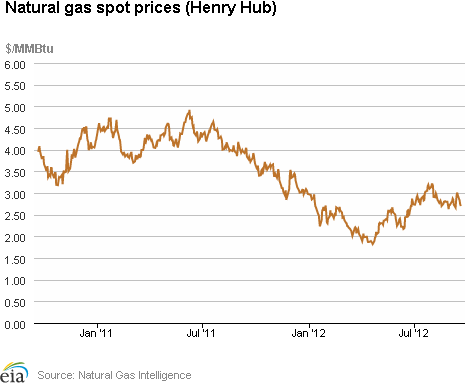
- Natural gas prices generally registered overall increases for the report week (Wednesday to Wednesday) at many of the country's trading locations. The Henry Hub price rose steadily through much of the reporting period to close at $2.92 per million British thermal units (MMBtu) yesterday (up 22 cents per MMBtu for the week).
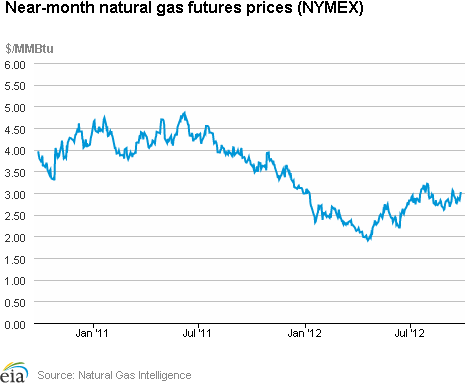
- The natural gas futures market trended higher over most of the week. At the New York Mercantile Exchange (NYMEX), the October 2012 natural gas contract gained 26.1 cents per MMBtu to close at $3.023 per MMBtu yesterday.
- Working natural gas in storage rose last week to 3,576 Bcf as of Friday, September 21, according to the EIA's Weekly Natural Gas Storage Report (WNGSR). An implied storage build of 80 Bcf for the week positioned storage volumes 296 Bcf above year-ago levels.
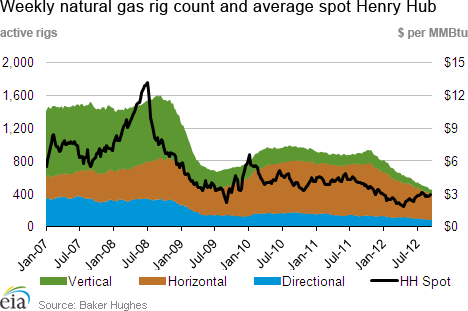
- The natural gas rotary rig count, as reported by Baker Hughes Incorporated on September 21, increased by 6 to 454 active units. Meanwhile, oil-directed rigs dropped by 11 to 1,402 units.
Prices:
The Henry Hub day-ahead price registered a generally steady increase for the week, stalling briefly on Friday before resuming an upward track for the balance of the reporting period, closing at $2.92 per MMBtu yesterday, up 8.1 percent. Prices at many downstream trading locations recorded overall increases, generally dipping somewhat before rebounding toward the end of the reporting week. For example, the Southern California Border Average price ended higher as temperatures remained relatively warm for much of the period (reaching 94 degrees in Los Angeles over the weekend); prices started the report week at $2.98 per MMBtu and finished yesterday at $3.21 per MMBtu, up 7.7 percent. Prices at the Transcontinental Pipeline's Zone 6 trading point (which serves New York City markets) declined from $2.91 per MMBtu last Wednesday to $2.83 per MMBtu on Friday, then rebounded to $3.07 per MMBtu by week's end (up 5.5 percent).
Certain locations in the Northeast saw prices trending considerably lower following completion of pipeline maintenance on Algonquin Gas Transmission's system. At the Algonquin Citygate trading point (for delivery into Boston), spot prices started the current reporting week at $3.72 per MMBtu, but continued last week's steady decline, dipping to $3.06 per MMBtu on Monday before regaining some ground on Tuesday and yesterday, closing at $3.18 per MMBtu (down 14.5 percent for the week). Algonquin Citygate prices had reached $4.52 per MMBtu during the previous reporting week.
At the NYMEX, the October 2012 contract, which expired yesterday, ended the week significantly higher, rising from $2.762 per MMBtu last Wednesday to $3.023 per MMBtu yesterday, an increase of 9.4 percent. Prices rose Thursday and Friday, and then again after falling on Monday to close yesterday up 26.1 cents per MMBtu overall. The November contract, which moves into the near-month position today, rose from $2.945 per MMBtu last Wednesday to $3.215 per MMBtu yesterday. The 12-Month Strip (average of September 2012 to August 2013 contracts) rose through much of the reporting week, closing at $3.215 per MMBtu, up 27 cents per MMBtu (9.2 percent).
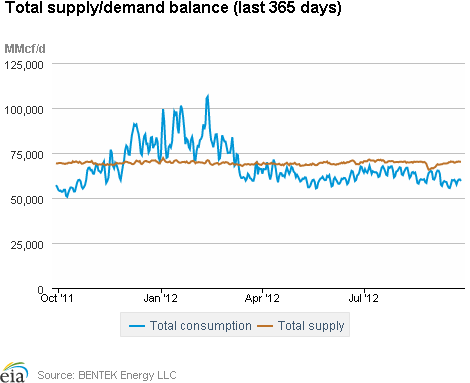
Total consumption for the report week registered an overall increase, with higher residential/commercial and industrial sector demand offsetting a modest decrease in power burn. According to estimates from BENTEK Energy LLC (Bentek), domestic natural gas consumption rose by 2.6 percent from last week, driven by increases of 11.7 percent and 1.4 percent, respectively, in residential/commercial and industrial sector consumption. For the power sector, consumption dipped by 1.0 percent, yet still exceeded levels for the same week last year by 13.6 percent.
Total supply for the week registered an overall increase of just 0.3 percent, reflecting unchanged dry gas production for the reporting period relative to last week. According to Bentek estimates, domestic weekly dry gas production averaged 64.3 Bcf per day, virtually identical to the previous reporting week (although 1.2 percent above the same time last year). Imports from Canada rose 4.6 percent, as increases in shipments to the Northeast and Midwest offset declines in the West. For the week, imports from Canada stand 1.9 percent above year-ago volumes. Liquefied natural gas (LNG) sendout dropped significantly, down 13.5 percent from last week; sendout volumes remain well below (57.4 percent) year-ago levels.
Storage
Working natural gas in storage increased to 3,576 Bcf as of Friday, September 21, according to EIA's WNGSR. This represents an implied net injection of 80 Bcf from the previous week. This week's injection was 4 Bcf above the 5-year (2007-2011) average injection of 76 Bcf, and 24 Bcf below last year's injection of 104 Bcf. Inventories are currently 296 Bcf (9.0 percent) greater than last year at this time and 282 Bcf (8.6 percent) greater than the 5-year average.
All three storage regions posted increases this week. Inventories in the East, West, and Producing regions increased by 46 Bcf (the 5-year average net injection is 47 Bcf), 5 Bcf (the 5-year average net injection is 9 Bcf), and 29 Bcf (the 5-year average net injection is 20 Bcf), respectively. In the Producing region, working natural gas inventories increased 15 Bcf (6.9 percent) in salt cavern facilities and increased 14 Bcf (1.5 percent) in nonsalt cavern facilities.
Temperatures during the storage report week were 0.9 degrees cooler than the 30-year normal temperature and 2.0 degrees warmer than the same period last year. Temperatures in the lower 48 States averaged 66.0 degrees, compared to 64.0 last year and the 30-year normal of 66.9 degrees. While overall temperatures were about a degree cooler than normal, temperatures varied somewhat across Census divisions. The Pacific Census division in the West was particularly warm, averaging 5.0 degrees warmer than the 30-year normal. In the Midwest, temperatures in the East North Central and West North Central Census divisions were cool, averaging 4.1 and 3.7 degrees cooler, respectively, than the 30-year normal.
See also:
| Spot Prices ($/MMBtu) | Thu, 20-Sep |
Fri, 21-Sep |
Mon, 24-Sep |
Tue, 25-Sep |
Wed, 26-Sep |
|---|---|---|---|---|---|
| Henry Hub | 2.76 |
2.76 |
2.82 |
2.84 |
2.92 |
| New York | 2.90 |
2.83 |
2.93 |
2.99 |
3.07 |
| Chicago | 2.94 |
2.91 |
2.96 |
2.95 |
2.99 |
| Cal. Comp. Avg,* | 3.06 |
3.00 |
3.10 |
3.15 |
3.19 |
| Futures ($/MMBtu) | |||||
| October Contract | 2.797 |
2.885 |
2.837 |
2.924 |
3.023 |
| November Contract | 2.962 |
3.071 |
3.033 |
3.105 |
3.215 |
| *Avg. of NGI's reported prices for: Malin, PG&E citygate, and Southern California Border Avg. | |||||
| Source: NGI's Daily Gas Price Index | |||||
| U.S. Natural Gas Supply - Gas Week: (9/19/12 - 9/26/12) | ||
|---|---|---|
Percent change for week compared with: |
||
last year |
last week |
|
| Gross Production | 1.21%
|
-0.05%
|
| Dry Production | 1.21%
|
-0.05%
|
| Canadian Imports | 1.93%
|
4.63%
|
| West (Net) | 20.83%
|
-2.83%
|
| MidWest (Net) | -13.13%
|
12.54%
|
| Northeast (Net) | -1.66%
|
11.95%
|
| LNG Imports | -57.36%
|
-13.45%
|
| Total Supply | 0.88%
|
0.26%
|
| Source: BENTEK Energy LLC | ||
| U.S. Consumption - Gas Week: (9/19/12 - 9/26/12) | ||
|---|---|---|
Percent change for week compared with: |
||
last year |
last week |
|
| U.S. Consumption | 10.84%
|
2.60%
|
| Power | 13.63%
|
-1.05%
|
| Industrial | 4.98%
|
1.43%
|
| Residential/Commercial | 14.15%
|
11.71%
|
| Total Demand | 11.39%
|
3.02%
|
| Source: BENTEK Energy LLC | ||
| Rigs | |||
|---|---|---|---|
Fri, September 21, 2012 |
Change from |
||
last week |
last year |
||
| Oil Rigs | 1,402 |
-0.78% |
30.91% |
| Natural Gas Rigs | 454 |
1.34% |
-50.22% |
| Miscellaneous | 3 |
0.00% |
-62.50% |
| Rig Numbers by Type | |||
|---|---|---|---|
Fri, September 21, 2012 |
Change from |
||
last week |
last year |
||
| Vertical | 508 |
-3.05% |
-16.58% |
| Horizontal | 1,149 |
1.41% |
0.79% |
| Directional | 202 |
-2.42% |
-16.53% |
| Source: Baker Hughes Inc. | |||
| Working Gas in Underground Storage | ||||
|---|---|---|---|---|
Stocks billion cubic feet (bcf) |
||||
| Region | 9/21/12
|
9/14/12
|
change |
|
| East | 1,921 |
1,875 |
46
|
|
| West | 502 |
497 |
5
|
|
| Producing | 1,153 |
1,124 |
29
|
|
| Total | 3,576 |
3,496 |
80
|
|
| Source: U.S. Energy Information Administration | ||||
| Working Gas in Underground Storage | |||||
|---|---|---|---|---|---|
Historical Comparisons |
|||||
Year ago (9/21/11) |
5-year average (2007-2011) |
||||
| Region | Stocks (Bcf) |
% change |
Stocks (Bcf) |
% change |
|
| East | 1,801 |
6.7 |
1,846 |
4.1 |
|
| West | 453 |
10.8 |
454 |
10.6 |
|
| Producing | 1,027 |
12.3 |
994 |
16.0 |
|
| Total | 3,280 |
9.0 |
3,294 |
8.6 |
|
| Source: U.S. Energy Information Administration | |||||
| Temperature -- Heating & Cooling Degree Days (week ending Sep 20) | ||||||||
|---|---|---|---|---|---|---|---|---|
HDD deviation from: |
CDD deviation from: |
|||||||
| Region | HDD Current |
normal |
last year |
CDD Current |
normal |
last year |
||
| New England | 31
|
-3
|
-25
|
2
|
0
|
-3
|
||
| Middle Atlantic | 22
|
-2
|
-23
|
3
|
-8
|
2
|
||
| E N Central | 45
|
17
|
-11
|
0
|
-12
|
-2
|
||
| W N Central | 46
|
13
|
-24
|
4
|
-13
|
1
|
||
| South Atlantic | 8
|
1
|
-13
|
56
|
-3
|
4
|
||
| E S Central | 11
|
4
|
-2
|
38
|
-8
|
3
|
||
| W S Central | 4
|
1
|
0
|
53
|
-25
|
-26
|
||
| Mountain | 23
|
-15
|
-11
|
40
|
3
|
5
|
||
| Pacific | 1
|
-10
|
-4
|
55
|
25
|
24
|
||
| United States | 23
|
2
|
-12
|
30
|
-4
|
2
|
||
|
Note: HDD = heating degree-day; CDD = cooling degree-day Source: National Oceanic and Atmospheric Administration | ||||||||
Average temperature (°F)
7-Day Mean ending Sep 20, 2012
Source: NOAA/National Weather Service
Deviation between average and normal (°F)
7-Day Mean ending Sep 20, 2012
Source: NOAA/National Weather Service