Today in Energy
Recent Today in Energy analysis of natural gas markets is available on the EIA website.
Market Highlights:
(For the week ending Wednesday, June 4, 2025)Prices
- Henry Hub spot price: The Henry Hub spot price fell 32 cents from $3.14 per million British thermal units (MMBtu) last Wednesday to $2.82/MMBtu yesterday.
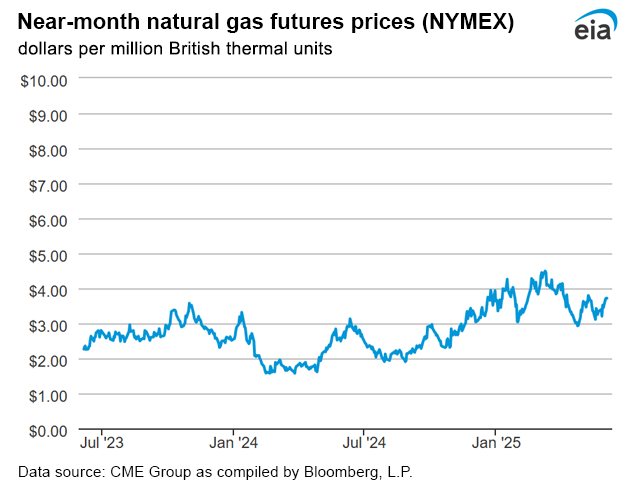
- Henry Hub futures price: The July 2025 NYMEX contract price increased to $3.716/MMBtu, up 16 cents from last Wednesday to yesterday. The price of the 12-month strip averaging July 2025 through June 2026 futures contracts climbed 15 cents to $4.188/MMBtu.
- Select regional spot prices: Natural gas spot prices fell at most locations this report week (Wednesday, May 28 to Wednesday, June 4). Price changes ranged from a decrease of $1.17/MMBtu at Northwest Sumas to an increase of $1.29/MMBtu at the Algonquin Citygate.
- Prices in the West were mixed this week. The price at Northwest Sumas on the Canada-Washington border, the main pricing point for natural gas in the Pacific Northwest, fell $1.17 from $1.61/MMBtu last Wednesday to 44 cents/MMBtu yesterday. The price reached an intraweek low of 11 cents/MMBtu on June 3, the lowest nominal price at this hub since data collection began in 1998, according to data from Natural Gas Intelligence. Prices at Northwest Sumas were the lowest among major pricing hubs in the United States during most of the report week. Average temperatures in the Pacific Northwest rose 3°F this report week to 58°F, resulting in 46 heating degree days (HDDs), a decrease of 22 HDDs from the previous report week. The price at PG&E Citygate in Northern California rose 7 cents, up from $3.26/MMBtu last Wednesday to $3.33/MMBtu yesterday. The price at SoCal Citygate in Southern California decreased 16 cents from $3.77/MMBtu last Wednesday to $3.61/MMBtu yesterday. Average temperatures in the San Jose Area rose 6°F this report week to 68°F, leading to 23 cooling degree days (CDDs), up from 0 CDDs last week. The San Jose Area also recorded 0 HDDs this week, down from 20 HDDs during the previous report week.
- International futures prices: International natural gas futures prices decreased this report week. According to Bloomberg Finance, L.P., weekly average front-month futures prices for liquefied natural gas (LNG) cargoes in East Asia decreased 16 cents to a weekly average of $12.29/MMBtu. Natural gas futures for delivery at the Title Transfer Facility (TTF) in the Netherlands decreased 40 cents to a weekly average of $11.75/MMBtu. In the same week last year (week ending June 5, 2024), the prices were $11.98/MMBtu in East Asia and $11.00/MMBtu at TTF. Top
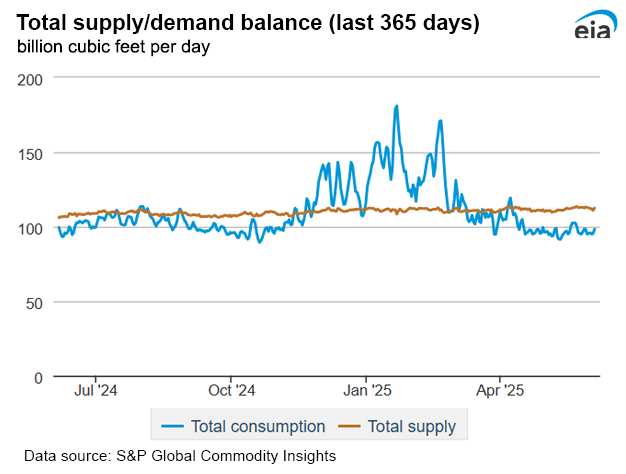
- Supply: According to data from S&P Global Commodity Insights, the average total supply of natural gas fell by 0.6% (0.7 billion cubic feet per day [Bcf/d]) compared with the previous report week. Dry natural gas production decreased by 0.4% (0.5 Bcf/d) to average 105.8 Bcf/d, and average net imports from Canada decreased by 2.7% (0.2 Bcf/d) from last week.
- Demand: Total U.S. consumption of natural gas fell by 0.3% (0.2 Bcf/d) compared with the previous report week, according to data from S&P Global Commodity Insights. Natural gas consumed for power generation rose by 10.1% (3.2 Bcf/d) week over week, as warmer weather was observed across much of the West and Mid-Continent. Consumption in the industrial sector decreased by 0.5% (0.1 Bcf/d) week over week and consumption in the residential and commercial sector declined by 23.2% (3.3 Bcf/d). Natural gas exports to Mexico decreased 2.4% (0.2 Bcf/d). Natural gas deliveries to U.S. LNG export facilities (LNG pipeline receipts) averaged 14.4 Bcf/d, or 1.1 Bcf/d lower than last week.
Daily spot prices by region are available on the EIA website.
Supply and Demand
Liquefied Natural Gas (LNG)
- Pipeline receipts: Average natural gas deliveries to U.S. LNG export terminals stood at 14.4 Bcf/d this week, down 7.1% (1.1 Bcf/d) from last week, according to data from S&P Global Commodity Insights. Natural gas deliveries to terminals in South Louisiana decreased 9.6% (0.9 Bcf/d) to 8.8 Bcf/d, and natural gas deliveries to terminals in South Texas fell 4.9% (0.2 Bcf/d), averaging 4.4 Bcf/d. Natural gas deliveries to terminals outside the Gulf Coast remained essentially unchanged at 1.2 Bcf/d this week.
- Vessels departing U.S. ports: Twenty-five LNG vessels with a combined LNG-carrying capacity of 94 billion cubic feet departed the United States between May 29 and June 4, according to shipping data provided by Bloomberg Finance, L.P.: six from Sabine Pass; five from Freeport; four from Corpus Christi; three each from Calcasieu Pass and Plaquemines; and two each from Cameron and Cove Point.
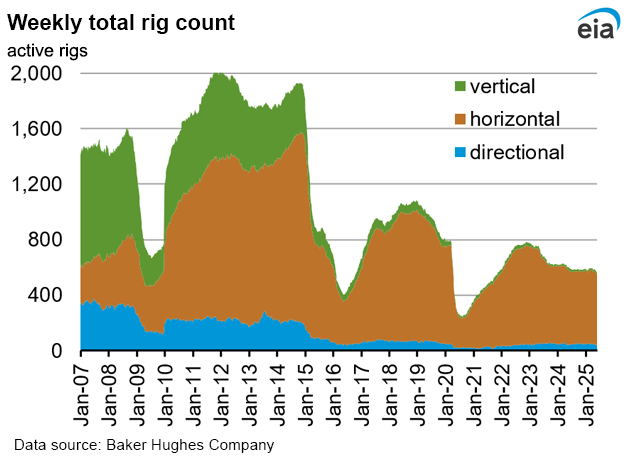
Rig Count
- According to Baker Hughes, for the week ending Tuesday, May 27, the natural gas rig count increased by 1 rig to 99 rigs, as the Eagle Ford added 1 rig. The number of oil-directed rigs fell by 4 rigs to 461 rigs, the lowest total oil-directed rig count since November 2021. The Ardmore Woodford, Permian, Utica, and Granite Wash each dropped one rig, and the Cana Woodford dropped two rigs. Two rigs were added among unidentified producing regions. The total rig count, which includes 3 miscellaneous rigs, now stands at 563 rigs, 37 fewer rigs than last year at this time.
Storage
- Net injections into storage totaled 122 Bcf for the week ending May 30, compared with the five-year (2020–24) average net injections of 98 Bcf and last year's net injections of 94 Bcf during the same week. Working natural gas stocks totaled 2,598 Bcf, which is 117 Bcf (5%) more than the five-year average and 288 Bcf (10%) lower than last year at this time.
- According to The Desk survey of natural gas analysts, estimates of the weekly net change to working natural gas stocks ranged from net injections of 108 Bcf to 130 Bcf, with a median estimate of 120 Bcf.
- The average rate of injections into storage is 29% higher than the five-year average so far in the refill season (April through October). If the rate of injections into storage matched the five-year average of 8.3 Bcf/d for the remainder of the refill season, the total inventory would be 3,870 Bcf on October 31, which is 117 Bcf higher than the five-year average of 3,753 Bcf for that time of year.
See also:
Top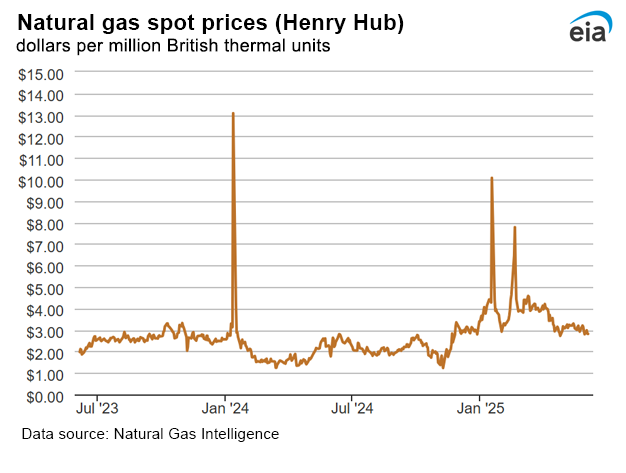
| Spot Prices ($/MMBtu) |
Thu,
29-May |
Fri,
30-May |
Mon,
02-Jun |
Tue,
03-Jun |
Wed,
04-Jun |
|---|---|---|---|---|---|
| Henry Hub |
2.94
|
2.80
|
2.98
|
2.82
|
2.82
|
| New York |
1.83
|
1.68
|
1.77
|
2.07
|
2.16
|
| Chicago |
2.76
|
2.41
|
2.49
|
2.51
|
2.78
|
| Cal. Comp. Avg.* |
2.87
|
2.61
|
2.84
|
2.79
|
2.99
|
| *Avg. of NGI's reported prices for: Malin, PG&E Citygate, and Southern California Border Avg. | |||||
| Data source: NGI's Daily Gas Price Index | |||||
| U.S. natural gas supply - Gas Week: (5/29/25 - 6/4/25) | |||
|---|---|---|---|
Average daily values (billion cubic feet) |
|||
this week |
last week |
last year |
|
| Marketed production | 119.5 |
120.0 |
114.7 |
| Dry production | 105.8 |
106.3 |
101.2 |
| Net Canada imports | 6.5 |
6.7 |
5.4 |
| LNG pipeline deliveries | 0.0 |
0.0 |
0.1 |
| Total supply | 112.4 |
113.0 |
106.7 |
|
Data source: S&P Global Commodity Insights | |||
| U.S. natural gas consumption - Gas Week: (5/29/25 - 6/4/25) | |||
|---|---|---|---|
Average daily values (billion cubic feet) |
|||
this week |
last week |
last year |
|
| U.S. consumption | 67.9 |
68.1 |
66.5 |
| Power | 34.6 |
31.4 |
34.7 |
| Industrial | 22.4 |
22.5 |
22.1 |
| Residential/commercial | 10.8 |
14.1 |
9.8 |
| Mexico exports | 7.2 |
7.4 |
7.0 |
| Pipeline fuel use/losses | 6.7 |
6.7 |
6.5 |
| LNG pipeline receipts | 14.4 |
15.5 |
13.4 |
| Total demand | 96.2 |
97.7 |
93.4 |
|
Data source: S&P Global Commodity Insights | |||
| Rigs | |||
|---|---|---|---|
Tue, May 27, 2025 |
Change from |
||
|
last week
|
last year
|
||
| Oil rigs |
461
|
-0.9%
|
-7.1%
|
| Natural gas rigs |
99
|
1.0%
|
-1.0%
|
| Note: Excludes any miscellaneous rigs | |||
| Rig numbers by type | |||
|---|---|---|---|
Tue, May 27, 2025 |
Change from |
||
|
last week
|
last year
|
||
| Vertical |
13
|
0.0%
|
-35.0%
|
| Horizontal |
508
|
-0.6%
|
-5.2%
|
| Directional |
42
|
0.0%
|
-4.5%
|
| Data source: Baker Hughes Company | |||
| Working gas in underground storage | ||||
|---|---|---|---|---|
Stocks billion cubic feet (Bcf) |
||||
| Region |
2025-05-30 |
2025-05-23 |
change |
|
| East |
498 |
462 |
36 |
|
| Midwest |
579 |
541 |
38 |
|
| Mountain |
205 |
198 |
7 |
|
| Pacific |
261 |
254 |
7 |
|
| South Central |
1,055 |
1,021 |
34 |
|
| Total |
2,598 |
2,476 |
122 |
|
|
Data source: U.S. Energy Information Administration Form EIA-912, Weekly Underground Natural Gas Storage Report Note: Totals may not equal sum of components because of independent rounding. | ||||
| Working gas in underground storage | |||||
|---|---|---|---|---|---|
Historical comparisons |
|||||
Year ago 5/30/24 |
5-year average 2020-2024 |
||||
| Region | Stocks (Bcf) |
% change |
Stocks (Bcf) |
% change |
|
| East |
570 |
-12.6 |
486 |
2.5 |
|
| Midwest |
684 |
-15.4 |
576 |
0.5 |
|
| Mountain |
217 |
-5.5 |
152 |
34.9 |
|
| Pacific |
272 |
-4.0 |
236 |
10.6 |
|
| South Central | 1,144 |
-7.8 |
1,031 |
2.3 |
|
| Total | 2,886 |
-10.0 |
2,481 |
4.7 |
|
| Data source: U.S. Energy Information Administration Form EIA-912, Weekly Underground Natural Gas Storage Report
Note: Totals may not equal sum of components because of independent rounding. |
|||||
| Temperature – heating & cooling degree days (week ending May 29) | ||||||||
|---|---|---|---|---|---|---|---|---|
HDDs |
CDDs |
|||||||
| Region | Current total |
Deviation from normal |
Deviation from last year |
Current total |
Deviation from normal |
Deviation from last year |
||
| New England | 60 |
20 |
55 |
0 |
-3 |
-16 |
||
| Middle Atlantic | 56 |
26 |
55 |
0 |
-10 |
-35 |
||
| E N Central | 62 |
26 |
47 |
0 |
-18 |
-16 |
||
| W N Central | 50 |
19 |
21 |
1 |
-22 |
-14 |
||
| South Atlantic | 25 |
14 |
25 |
46 |
-5 |
-32 |
||
| E S Central | 15 |
5 |
15 |
36 |
-7 |
-31 |
||
| W S Central | 3 |
1 |
3 |
82 |
11 |
-28 |
||
| Mountain | 32 |
-12 |
-20 |
33 |
3 |
13 |
||
| Pacific | 18 |
-12 |
-21 |
1 |
-10 |
1 |
||
| United States | 38 |
11 |
21 |
22 |
-8 |
-19 |
||
|
Data source: National Oceanic and Atmospheric Administration Note: HDDs=heating degree days; CDDs=cooling degree days | ||||||||
Average temperature (°F)
7-day mean ending May 29, 2025
Data source: National Oceanic and Atmospheric Administration
Deviation between average and normal temperature (°F)
7-day mean ending May 29, 2025
Data source: National Oceanic and Atmospheric Administration
Monthly U.S. dry shale natural gas production by formation is available in the
Short-Term Energy Outlook.