Executive Summary
This report highlights notable trends in energy-related carbon dioxide (CO2) emissions in the United States in 2024, based on preliminary data.
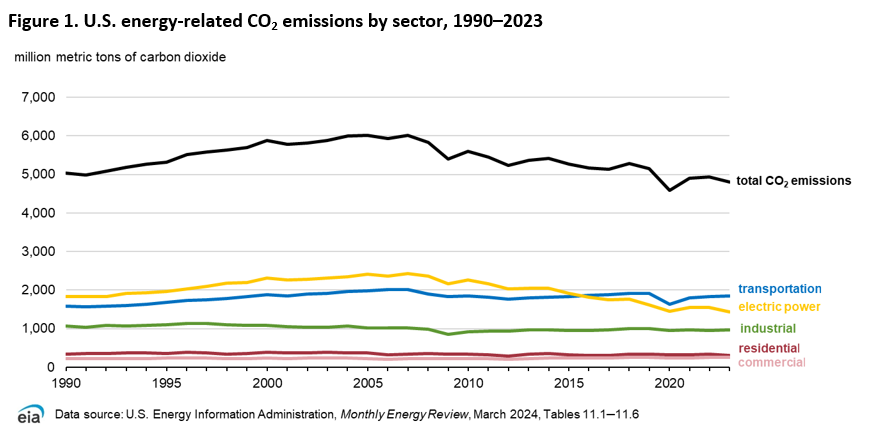
U.S. energy-related CO2 emissions declined overall by less than 1%, or 23 million metric tons (MMmt), in 2024. Among end-use sectors, the most notable decreases occurred in the residential and industrial sectors. Lower residential sector emissions were mostly due to decreases in consumption of natural gas and petroleum products primarily associated with space heating—mainly propane and distillate fuel oil. Decreases in industrial-sector emissions were associated with reduced manufacturing.
Emissions from the commercial, transportation, and electric power sectors remained relatively unchanged but are discussed in greater detail in later sections.
| Sector | 2024 | 2023 | 2022 | 2021 | 2020 |
|---|---|---|---|---|---|
| Residential | 303 | 313 | 340 | 325 | 319 |
| Commercial | 247 | 249 | 260 | 245 | 233 |
| Industrial | 947 | 962 | 960 | 977 | 953 |
| Transportation | 1,848 | 1,851 | 1,842 | 1,807 | 1,630 |
| Electric power | 1,427 | 1,421 | 1,539 | 1,553 | 1,450 |
| Total | 4,772 | 4,795 | 4,940 | 4,906 | 4,585 |
| Data source: U.S. Energy Information Administration, Monthly Energy Review, March 2025, Tables 11.1–11.6 Note: Totals may not equal sum of components due to independent rounding. |
|||||
Key Findings
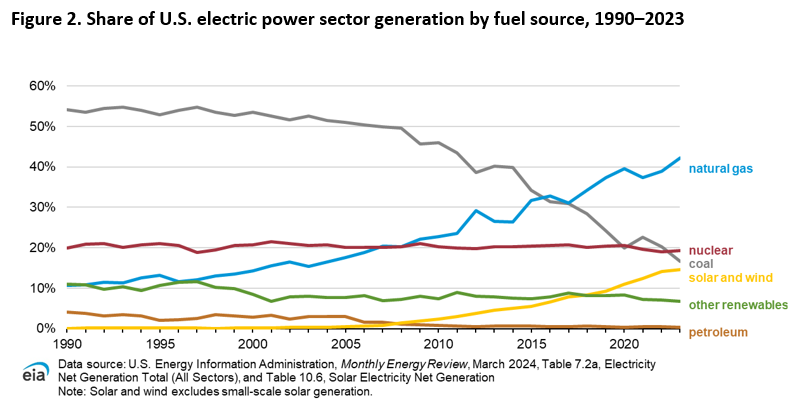
Electric power emissions remained flat as decreasing CO2 from coal generation offset increasing CO2 from natural gas
CO2 emissions from the electric power sector remained mostly flat in 2024, increasing by less than 1% (6 MMmt). Although overall electricity generation increased by 3%, or 122 terawatthours (TWh), in 2024, changes in generation sources resulted in sectoral CO2 emissions remaining near 2023 levels. Specifically:
- CO2 emissions from coal-fired generation decreased by 3% (24 MMmt), but:
- CO2 emissions from natural gas-fired generation increased by 4% (31 MMmt)
- Coal-fired electricity generation fell by 3% (22 TWh), but:
- Natural gas generation increased by 3% (59 TWh)
- Solar generation increased by 32% (53 TWh)
- Wind generation increased by 8% (32 TWh)
Although growth in natural gas-fired generation exceeded reductions in coal-fired generation, CO2 emissions did not increase as much because natural gas emits less CO2 per kilowatthour than coal when combusted.
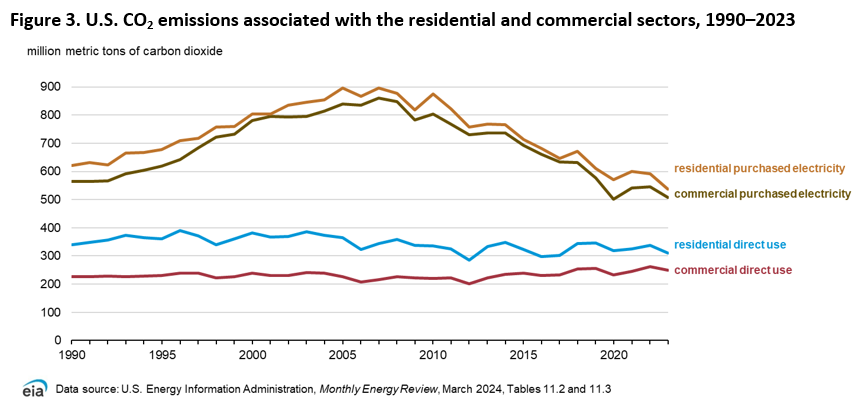
Warmer late-winter and early-spring weather led to lower residential sector emissions
Residential sector CO2 emissions declined 3% (10 MMmt) in 2024, as demand for heating decreased with relatively warm weather during late-winter and early-spring months. U.S. population-weighted heating degree days (HDDs), a measure of how cold a location is, decreased by 3% last year. Consequently, consumption of natural gas, propane, and distillate fuel oil declined, which are all key fuels in residential space heating.
Warmer weather also led to increased demand for space cooling during warmer months. Cooling degree days (CDDs), a measure of how hot a location is, increased by 10% in 2024. However, unlike space heating, space cooling relies on electricity rather than direct use of fuels. As summer temperatures increased relative to 2023, residential sector electricity use rose. Annual purchases of electricity increased by 3%, and emissions associated with residential electricity consumption increased by 1% (5 MMmt). Overall, total residential sector emissions were lower because the decline in CO2 emissions from lower heating fuel consumption outweighed increases associated with cooling demand.
Weather-related impacts on energy consumption and CO2 emissions in the commercial sector mirrored the residential sector but to a lesser extent. Commercial sector emissions remained effectively flat in 2024, decreasing by only 2 MMmt, as a result of lower natural gas and petroleum consumption.
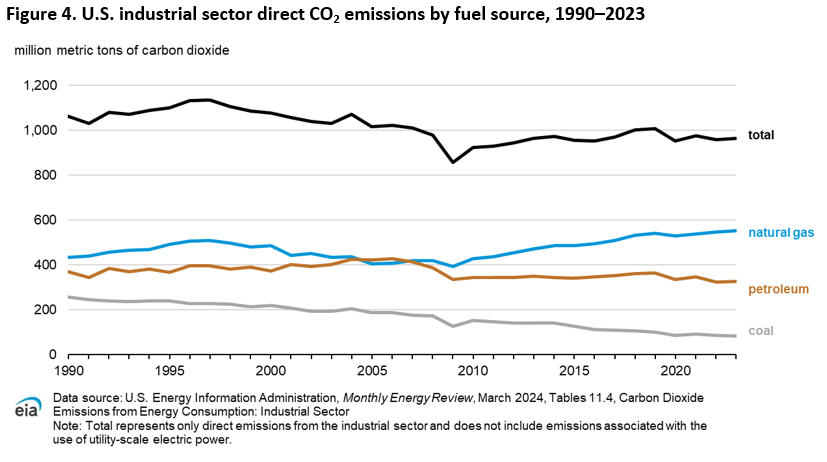
Industrial CO2 emissions decreased in 2024 as industrial production growth slowed
CO2 emissions from the U.S. industrial sector decreased by 1% (14 MMmt) in 2024. Decreased emissions were mostly related to a 15% (7 MMmt) decrease in petroleum coke consumption and a 6% (5 MMmt) decrease in coal consumption. Declining emissions from these fuels is associated with minor declines in industrial activity, such as manufacturing of primary metals.
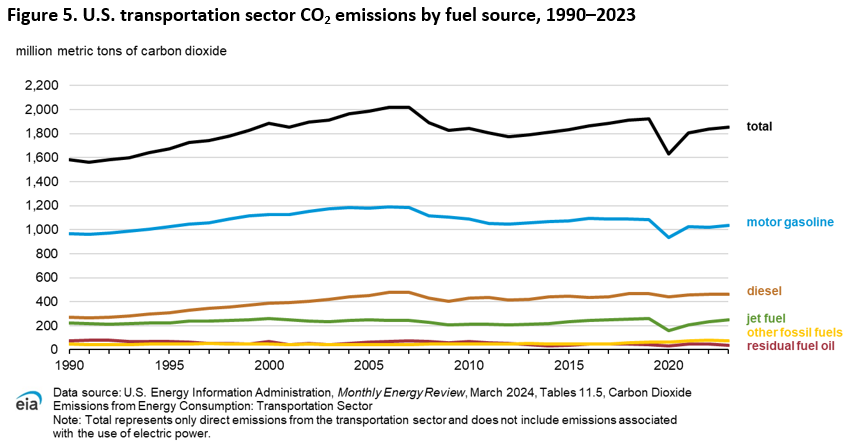
Transportation sector emissions remain unchanged as increased consumption of some petroleum products offset decreases in others
U.S. transportation sector emissions remained virtually unchanged in 2024. CO2 emissions from motor gasoline and jet fuel increased slightly, following the trend from 2023, but were more than offset by decreases in CO2 emissions from distillate fuel oil.
CO2 emissions from motor gasoline increased by less than 1% (3 MMmt) in 2024. Despite steady increases in vehicle miles traveled, motor gasoline emissions have generally declined modestly over the last 20 years (Figure 5). These decreases in motor gasoline emissions are mostly due to higher vehicle fuel economy standards and, to a lesser extent, increased deployment of electric vehicles. Jet fuel emissions increased by 3% (7 MMmt) in 2024, mostly associated with increased air travel.
Higher motor gasoline and jet fuel emissions were more than offset by declining emissions from distillate fuel oil, which fell by 3% (15 MMmt) in 2024. Distillate consumption declined because on-road diesel vehicles consumed less and, to a lesser extent, conventional diesel fuel was substituted for renewable diesel.
Background and Data
We based our analysis of U.S. energy-related CO2 emissions in this report on data published in our Monthly Energy Review (MER). This initial analysis is based on preliminary 2024 data first published in the March 2025 edition of the MER. These values are subject to change as final data are published from underlying sources, according to source data revision policies and publication schedules. We expect relatively minor differences between the preliminary and revised estimates based on past years (Table 2). Supplemental analysis, figures from past reports, and a discussion of the methodology and terminology used in this report are available in the Appendix.
| Year | Preliminary CO2 estimates (million metric tons) |
Revised CO2 estimates (million metric tons) |
Difference (million metric tons) |
Percentage difference |
|---|---|---|---|---|
| 2018 | 5,274 | 5,269 | -5 | -0.1% |
| 2019 | 5,138 | 5,149 | 11 | 0.2% |
| 2020 | 4,571 | 4,575 | 4 | 0.1% |
| 2021 | 4,870 | 4,904 | 34 | 0.7% |
| 2022 | 4,970 | 4,941 | -29 | -0.6% |
| 2023 | 4,807 | 4,791 | -16 | -0.3% |
| Data source: U.S. Energy Information Administration, Monthly Energy Review, Tables 11.1–11.6, March and September editions, 2019–2024 | ||||
Emissions values and analysis presented in this report pertain only to U.S. CO2 emissions associated with fossil-fuel combustion and non-combustion applications of energy products (for example, as industrial feedstocks). We do not include estimates of CO2 emissions outside this scope or other greenhouse gas emissions burned or released in production, extraction, or distribution of energy products. Our approach may result in discrepancies between our emissions estimates and those of other organizations, including other U.S. government agencies.
In addition to historical estimates, we also offer short-term forecasts and long-term projections of U.S. energy-related CO2 emissions in several other data products. You can find a short-term forecast of U.S. energy-related CO2 emissions and key drivers in our monthly Short-Term Energy Outlook, which includes monthly forecasts by fuel source currently through the end of 2026 and the latest estimates of the effects of recent events on energy markets and energy-related CO2 emissions. We publish long-term U.S. emissions projections in our Annual Energy Outlook, which provides annual projections of energy-related CO2 emissions by fuel source, sector, and end use through 2050. Projections of international energy-related CO2 emissions through 2050 are available in our International Energy Outlook.