 View the dashboard ›

One in three U.S. households faced challenges in paying energy bills in 2015
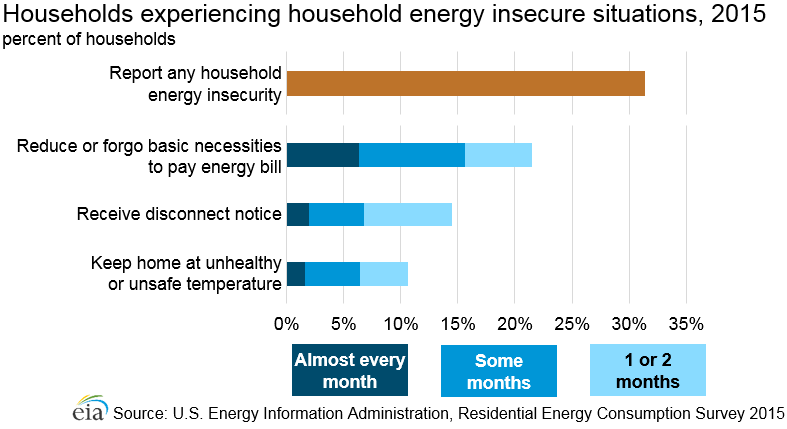
Nearly one-third of U.S. households (31%) reported facing a challenge in paying energy bills or sustaining adequate heating and cooling in their home in 2015. According to the most recent results from EIA’s Residential Energy Consumption Survey (RECS), about one in five households reported reducing or forgoing basic necessities like food and medicine to pay an energy bill and 14% reported receiving a disconnection notice for energy service. Households may have also used less energy than they would prefer to: 11% of households surveyed reported keeping their home at an unhealthy or unsafe temperature.
The 2015 RECS asked about these and other challenges, including paying energy bills and repairing broken equipment in the home. Households experiencing these circumstances, often considered components of household energy insecurity, may be making difficult financial tradeoffs about which basic needs to fulfill.
The 2015 RECS questionnaire captured both the occurrence of household energy insecurity and the severity of household energy insecurity in 2015, measured by the frequency of energy insecure events lasting anywhere from a few weeks to most of the year. Of the 25 million households that reported forgoing food and medicine to pay energy bills, 7 million faced that decision nearly every month. Of the 17 million households who reported receiving a disconnection notice, 2 million answered that this occurred nearly every month.
Occasionally, households may lose the use of heating or air-conditioning equipment entirely. This can occur when equipment breaks and a household cannot afford to fix it, as well as when a household cannot afford fuel for their equipment. The 2015 RECS results show that seven million households (6% of the national total) experienced the inability to use heating equipment at some point in 2015 and 6 million (5%) experienced the loss of air conditioning. These issues occurred during a year when overall energy-related expenditures were at their lowest point in over a decade.
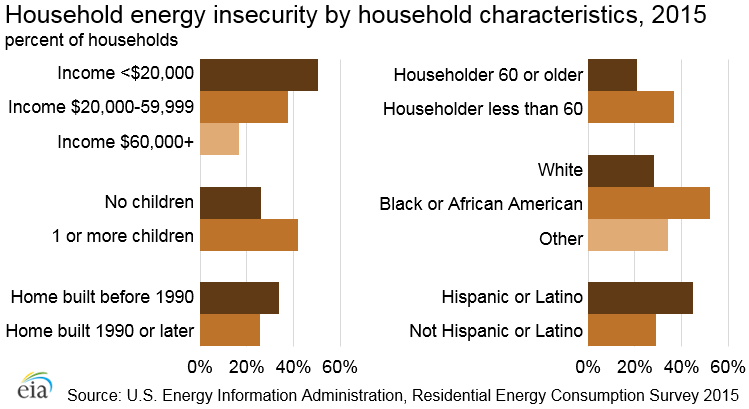
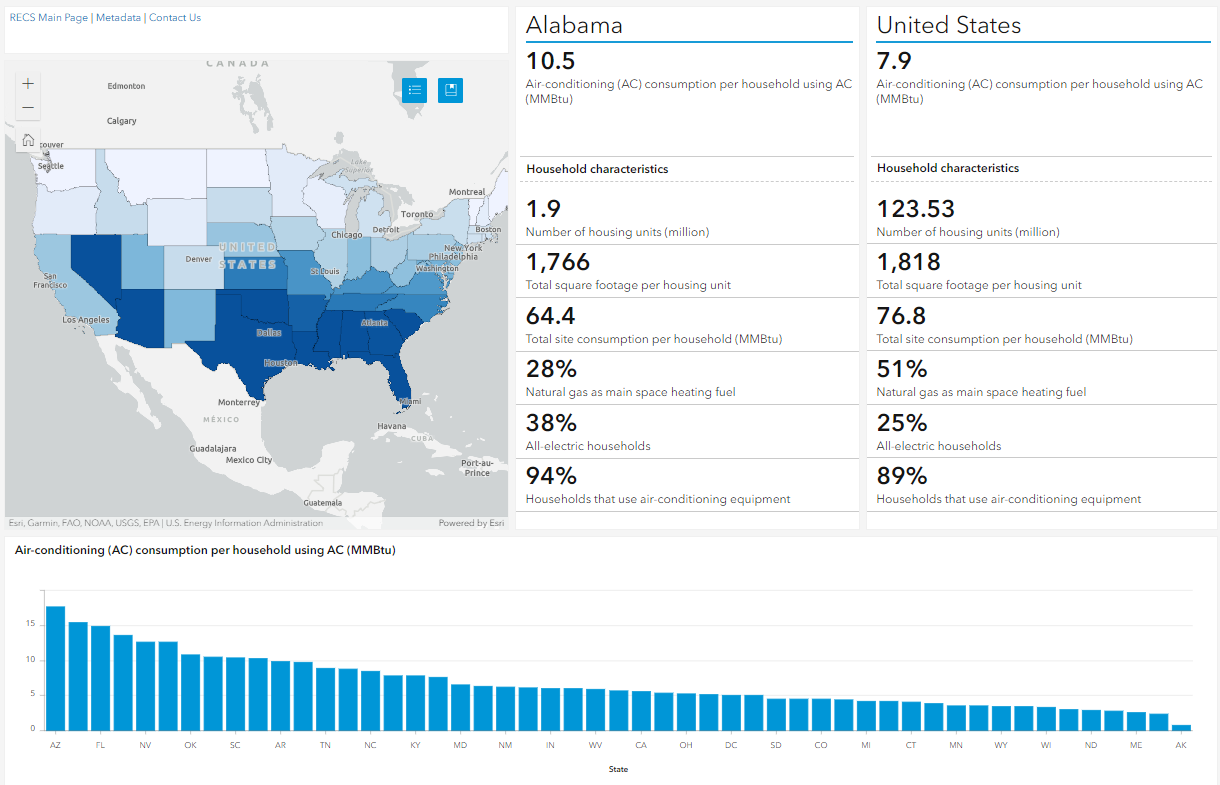
Only minor differences were found across geographic regions of the country and between urban and rural respondents. This suggests that a household's ability to afford energy and maintain equipment is more related to structural features and demographic characteristics than to geography and associated climates. For instance, households that included children, who had residents that identified with a minority racial group or as Hispanic, or were low income experienced more energy insecurity. Households experiencing energy insecurity were also more likely to live in homes built before 1990.
Additional information on household energy insecurity and energy usage in all homes is available in 2015 RECS reports, tables, and a public-use microdata file.
Specific questions on this product may be directed to Chip Berry.