1993 RECS Survey Data 2024 | 2020 | 2015 |2009 | 2005 | 2001 | 1997 | 1993 | Previous
- Housing characteristics
- Consumption & expenditures
- Microdata
- Methodology
Consumption & Expenditures Tables
Energy End Uses Ranked by Energy Consumption, 1989
The following 28 tables present detailed data describing the consumption of and expenditures for energy used by households in the residential sector. The data are presented at the national level, Census region and division levels, for climate zones and for the most populous States, as well as for other selected characteristics of households. This section provides assistance in reading the tables by explaining some of the headings for the categories of data. It also explains the use of the row and column factors to compute the relative standard error of the estimates given in the tables.
Organization of the Tables
The tables cover consumption and expenditures for six topical areas:
- Major Energy Source
- Space-Heating End Use
- Air-Conditioning End Use
- Water-Heating End Use
- Refrigerator End Use
- Appliance End Use
The tables displaying data by major source (Tables 5.1 through 5.10) present household energy consumption and expenditure data that were obtained from the energy suppliers of the households. The tables present the average consumption and expenditures for all energy sources, followed by tables displaying statistics on individual energy sources. Statistics are provided both for the aggregate of all households and by per-household averages.
The tables presenting data by total end use and by space heating, air-conditioning, water heating, refrigerators, and appliances (Tables 5.11 through 5.28) contain nonlinear regression estimates of energy consumption and expenditures. Details concerning the methodology used for the end-use estimates are in Appendix C, "End-Use Estimation Methodology." Data are presented for a total of all energy sources, followed by tables displaying statistics for each energy source. Statistics are provided both by all households and per household averages.
Statistical Significance of Data
Row and Column Factors
The tables provide row factors in the far-right column and column factors on the top line of each table. These factors are to be used to determine the Relative Standard Error (RSE) for each estimate, which, in turn, can be used to determine the standard error and the confidence level of the estimate and to determine whether the difference between any two figures is statistically significant. However, since the RSE's are only approximate, standard errors, confidence intervals, and statistical tests must also be regarded as only approximate. For more details about the derivation of the row and column RSE factors, see Appendix B, "Quality of the Data."
To calculate the RSE for a specific estimate, multiply the row factor by the column factor, as illustrated in Figure 5.1, an excerpt from Table 5.10 of this report. This table shows that the average expenditure for natural gas in 1993 among U. S. households that were located in suburban areas was $6.03 per million Btu. Multiplying 1.9 (the row factor) by 0.8 (the column factor) yields an approximate RSE of 1.52 percent.
Figure 5.1. Use of RSE Row and Column Factor
Standard Errors
Since the estimates presented in the following tables are based on a sample of residential housing units, they are subject to sampling error, or standard error. To determine the standard error for an estimate in these tables, multiply the approximate RSE by the estimate. For example, to determine the standard error of the average expenditures for natural gas in 1993 among U.S. households located in suburban areas, multiply $6.03 per million Btu by .0152 (the approximate RSE). The result, $0.09 per million Btu, is the approximate standard error for the estimate.
Confidence Levels
Statistical Significance Between Two Statistics
| All Tables - (file size 665,893 bytes) pages: 97 | |
|---|---|
| Energy Consumption and Expenditures tables - (file size 198,280 bytes) pages: 31. Table 5.1: Average of All Major Source Table 5.2: Consumption by Each Major Source Table 5.3: Expenditures by Each Major Source Table 5.4: Electricity, per Household Table 5.5: Natural Gas, per Household Table 5.6: Fuel Oil, per Household Table 5.7: Kerosene, per Household Table 5.8: Liquefied Petroleum Gas (LPG), per Household Table 5.9: Wood Consumption Table 5.10: Average Expenditures by Each Major Energy Source |
|
| Energy End Use tables - (file size 69,589 bytes) pages: 9. Table 5.11: Consumption and Expenditures by End Use Table 5.12: Consumption by End Use, per Household Table 5.13: Expenditures by End Use, per Household |
|
| Space-Heating Consumption and Expenditures tables - (file size 152,578 bytes) pages: 21. Table 5.14: Electricity and Natural Gas Table 5.15: Fuel Oil, Kerosene, and LPG Table 5.16: Electricity, per Household Table 5.17: Natural Gas, per Household Table 5.18: Fuel Oil, per Household Table 5.19: LPG, per Household |
|
| Air-Conditioning Consumption and Expenditures tables - (file size 63,033 bytes) pages: 7 Table 5.20: Electricity for all A/C and Central A/C Table 5.21: Electricity for Room A/C |
|
| Water-Heating Consumption and Expenditures tables - (file size 100,233 bytes) pages: 14. Table 5.22: Electricity and Natural Gas Table 5.23: Fuel Oil and Natural Gas Table 5.24: Electricity and Natural Gas, per Household Table 5.25: Fuel Oil and Natural Gas, per Household |
|
| Appliances and Refrigerator Consumption and Expenditures tables - (file size 74,699 bytes) pages: 10. Table 5.26: Electricity, Natural Gas, and LPG Table 5.27: Electricity, per Household Table 5.28: Natural Gas and LPG, per Household |
The following tables are unpublished Census Region and State-level data based on the energy consumption data collected from the1993 Residential Energy Consumption Survey. The State data are based on the four largest populated States: California, Florida, New York, and Texas.
| Region | State |
|---|---|
| Northeast | California |
| Midwest | Florida |
| West | New York |
| South | Texas |
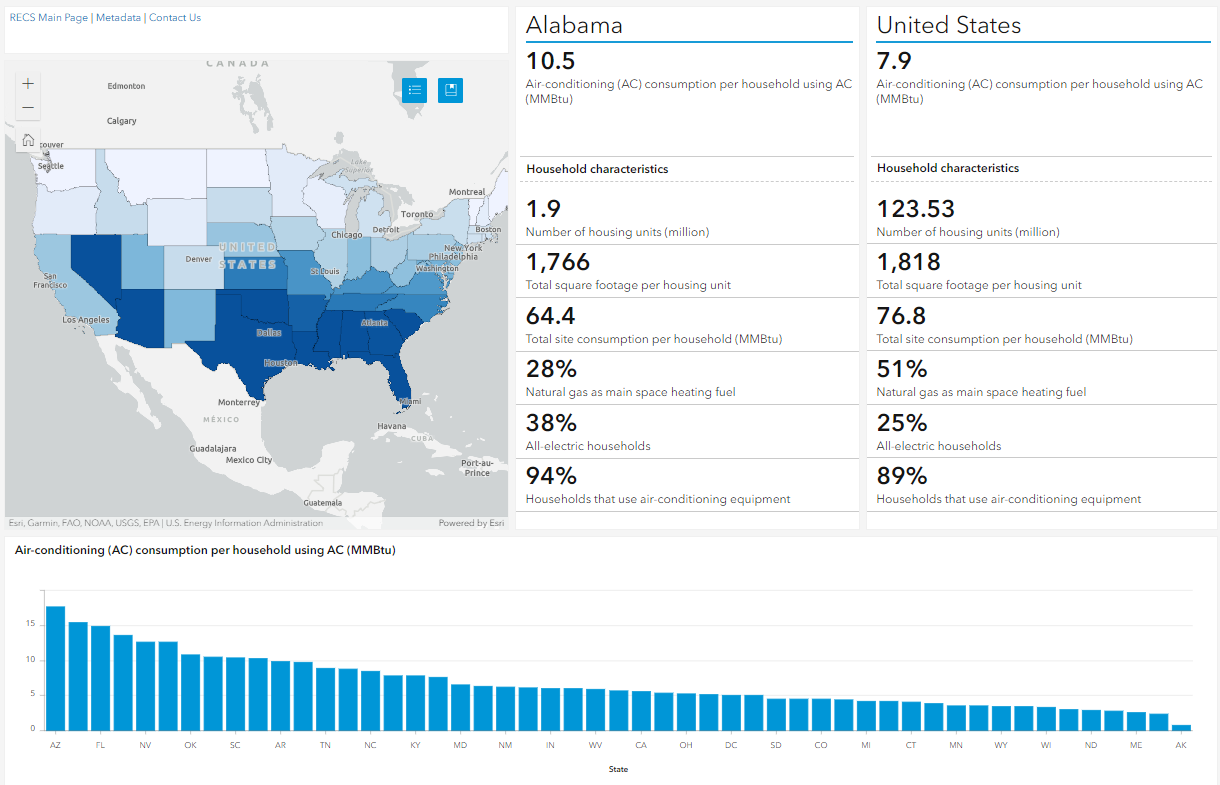 View the dashboard ›
