Older than 3780 days
State Energy Data System: Total Energy for 2014
May 26, 2016
Annual state-level estimates for total energy consumption, prices, and expenditures.
Determinants of Household Use of Selected Energy Star Appliances
May 25, 2016
The main objective of this paper is to test a series of hypotheses regarding the influences of household characteristics (such as education, age, sex, race, income, and size of household), building characteristics (such as age, ownership, and type), and electricity prices on the use of ENERGY STAR appliances.
Monthly Energy Review
May 25, 2016
EIA's most comprehensive report on recent integrated energy statistics. Preliminary data indicate that, in February 2016, U.S. total primary energy consumption equaled 8.3 quadrillion Btu, a 4% decrease from February 2015. The electric power sector accounted for 35% of the total, the transportation sector for 26%, the industrial sector for 22%, the residential sector for 11%, and the commercial sector for 6%.
2015 Uranium Marketing Annual Report
May 24, 2016
Statistical data update for 2015 of uranium marketing activities in the United States.
Prime Supplier Report
May 23, 2016
The latest Prime Supplier Report presents data collected through March 2016 on Form EIA-782C, "Monthly Report of Prime Supplier Sales of Petroleum Products Sold for Local Consumption." These data measure primary petroleum product deliveries into the states where they are locally marketed and consumed.
State Energy Profiles: New data for February and March 2016, new annual data, and updated analytical narratives and Quick Facts
May 19, 2016
New monthly data are available for electricity, petroleum, and coal series. The Profiles also feature new annual data on coal, alternative-fuel vehicles, and energy infrastructure. In addition, analytical narratives and Quick Facts have been updated for Alabama, American Samoa, Guam, Mississippi, the Northern Mariana Islands, Tennessee, and the U.S. Virgin Islands.
Angola Country Analysis Brief
May 18, 2016
Angola is the second-largest oil producer in sub-Saharan Africa. The country experienced an oil production boom between 2002 and 2008 when production started at several deepwater fields.
2012 CBECS consumption and expenditures, detailed tables, and public use microdata
May 17, 2016
With this release, the CBECS consumption and expenditures data is complete. The 2012 CBECS consumption and expenditures detailed tables are comprised of Tables C1-C38, which cover overall electricity, natural gas, fuel oil and district heat consumption, and tables E1-E11, which disaggregate the same energy sources by end use (heating, cooling, lighting, etc.). All of the detailed tables contain extensive row categories of building characteristics.
AEO2016 Early Release: Summary of Two Cases
May 17, 2016
This release is an annotated PowerPoint summary and the data for two cases from the Annual Energy Outlook 2016. The cases released today are the Reference case, which includes one possible implementation of the final Clean Power Plan (CPP) rule promulgated by the Environmental Protection Agency, and a No-CPP case, which assumes that the CPP rule is not implemented. Both cases show substantially more growth in electricity generation from wind and solar energy than EIA's previous projections. Wind and solar capacity additions are particularly robust through the early 2020s, reflecting the extensions of tax credits for these technologies enacted in December and lower estimates of their capital costs than in previous projections. In the Reference case, CPP implementation plays a significant role in the deployment of solar power through the end of the projection period and in an expanded role for natural gas-fired generation.
Drilling Productivity Report
May 16, 2016
EIA’s monthly Drilling Productivity Report (DPR) has been released. The DPR takes a fresh look at oil and natural gas production, starting with an assessment of how and where drilling for hydrocarbons is taking place. It uses recent data on the total number of drilling rigs in operation along with estimates of drilling productivity and estimated changes in production from existing oil and natural gas wells to provide estimated changes in oil and natural gas production for seven key fields.
Financial Review: Annual 2015
May 13, 2016
This analysis focuses on the financial and operating trends of 77 global oil and natural gas companies (called the energy companies).
State Energy Data System: Noncombustible Renewable Energy for 2014
May 13, 2016
Annual state-level consumption estimates for hydroelectric power, as well as wind, solar, and geothermal energy.
Alternative Fuel Vehicle Data
May 12, 2016
EIA releases annual data for 2014 about alternative fuel vehicle (AFV) supply and fuel use and number of vehicles for four types of vehicle fleets: federal government, state government, transit agencies, and fuel providers.
International Energy Outlook 2016
May 11, 2016
Projections of world energy supply and demand through 2040.
Short-Term Energy Outlook - Market Prices and Uncertainty Report
May 10, 2016
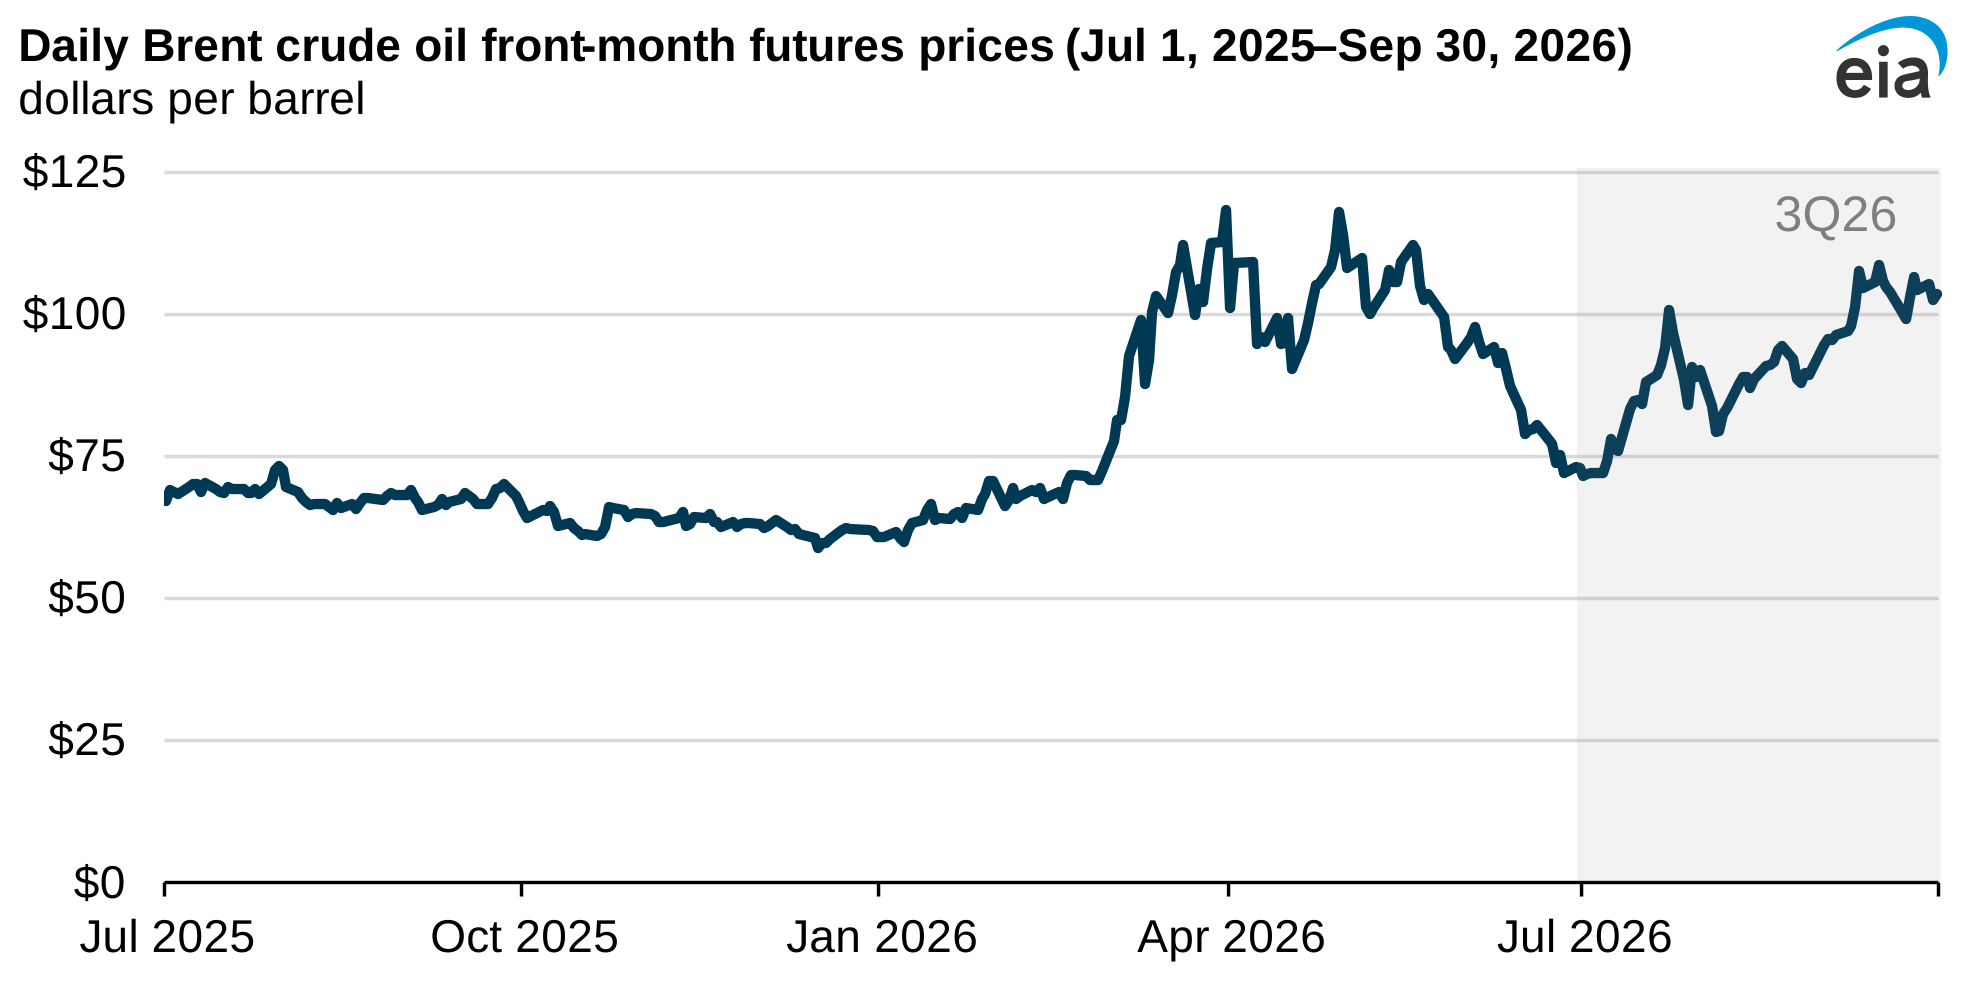
Crude oil prices continued upward and reached the highest levels of the year. The North Sea Brent front-month futures price rose $6.34 per barrel (b) from April 1 to settle at $45.01/b on May 5 (Figure 1). The West Texas Intermediate (WTI) front-month futures price rose $7.53/b and settled at $44.32/b over the same period.
Short-Term Energy Outlook
May 10, 2016
North Sea Brent crude oil prices averaged $42/barrel (b) in April, a $3/b increase from March. Improving economic data, growing supply disruptions, and falling U.S. crude oil production and rig counts contributed to the price increase.
Nigeria Country Analysis Brief
May 6, 2016
Nigeria is the largest oil producer in Africa and is among the world’s top five largest exporters of liquefied natural gas (LNG). Supply disruptions, typically caused by pipeline sabotage from thieves siphoning crude oil and condensate, are common in Nigeria’s oil and natural gas industries. Pipeline sabotage and oil supply disruptions have increased in 2016, leading to a decline in Nigeria’s crude oil production. Because Nigeria heavily depends on oil revenue, its economy is noticeably affected by changes to its oil production and/or to global crude oil prices. The IMF projects that Nigeria’s oil and natural gas exports earned $52 billion in 2015, $35 billion less than in 2014, which is mostly attributed to the fall in oil prices that began in mid-2014.
Domestic Uranium Production Report – Quarterly
May 5, 2016
First quarter 2016 update of uranium production in the United States and operating status of U.S. uranium mills and plants.
2015 Domestic Uranium Production Report
May 5, 2016
Statistical data update for 2015 on drilling, mining, production, shipments, sales, facilities, employment, expenditures, and reserve estimates in the U.S. uranium production industry.
Petroleum Marketing Monthly
May 2, 2016
The May 2016 Petroleum Marketing Monthly (PMM), with data through February 2016, presents monthly and annual price and volume statistics covering crude oil and refined products sales in the United States.
In this edition of the PMM, preliminary monthly data show prices for crude oil and finished petroleum products continued to fall in February, while Prime Supplier data show sales of gasoline and No. 2 distillates increased from January levels.