U.S. Energy Information Administration logo
Skip to sub-navigation

Total Energy

Annual Energy Review

September 2012  PDF | previous editions
Release Date: September 27, 2012

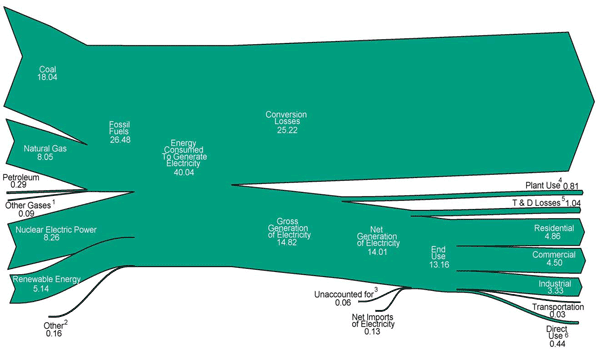
Electricity Flow,  (Quadrillion Btu)
Electricity Flow diagram image

Footnotes:
1 Blast furnace gas, propane gas, and other manufactured and waste gases derived from fossil fuels.
2 Batteries, chemicals, hydrogen, pitch, purchased steam, sulfur, miscellaneous technologies, and non-renewable waste (municipal solid waste from non-biogenic sources, and tire-derived fuels).
3 Data collection frame differences and nonsampling error. Derived for the diagram by subtracting the "T & D Losses" estimate from "T & D Losses and Unaccounted for" derived from Table 8.1.
4 Electric energy used in the operation of power plants.
5 Transmission and distribution losses (electricity losses that occur between the point of generation and delivery to the customer) are estimated as 7 percent of gross generation.
6 Use of electricity that is 1) self-generated, 2) produced by either the same entity that consumes the power or an affiliate, and 3) used in direct support of a service or industrial process located within the same facility or group of facilities that house the generating equipment. Direct use is exclusive of station use.

Notes:
• Data are preliminary.
• See Note, "Electrical System Energy Losses," at the end of Section 2.
• Net generation of electricity includes pumped storage facility production minus energy used for pumping.
• Values are derived from source data prior to rounding for publication.
• Totals may not equal sum of components due to independent rounding.

Sources:
U.S. Energy Information Administration, Annual Energy Review 2011 Tables 8.1, 8.4a, 8.9, A6 (column 7), and U.S. Energy Information Administration, Form EIA-923, "Power Plant Operations Report."

Changes to the AER

  • Tables with grayed-out numbers go to the MER (the most recent data). The remaining tables still go to the AER 2011 (data through 2011). In some cases the table numbering of the AER differs from that of the MER.
  • Explanatory notes for the most recent AER can be found in archived AER 2011 (data year dropdown above). MER notes and sources are linked at the bottom of the interactive tables.
  • See a full list of content changes to all AER reports by year. >

Statistics
Analysis
Tools
Education
News

Petroleum & Other Liquids

Crude oil, gasoline, heating oil, diesel, propane, and other liquids including biofuels and natural gas liquids.

Natural Gas

Exploration and reserves, storage, imports and exports, production, prices, sales.

Electricity

Sales, revenue and prices, power plants, fuel use, stocks, generation, trade, demand & emissions.

Coal

Reserves, production, prices, employment and productivity, distribution, stocks, imports and exports.

Nuclear & Uranium

Uranium fuel, nuclear reactors, generation, spent fuel.

Renewable & Alternative Fuels

Includes hydropower, solar, wind, geothermal, biomass and ethanol.

EIA Survey Forms

Forms EIA uses to collect energy data including descriptions, links to survey instructions, and additional information.

Total Energy

Comprehensive data summaries, comparisons, analysis, and projections integrated across all energy sources.

U.S. States

State energy information, including overviews, rankings, data, and analyses.

International

International energy information, including overviews, rankings, data, and analyses.

Environment

Greenhouse gas data, voluntary reporting, electric power plant emissions.

Data Tools, Apps, & Maps

Tools to customize searches, view specific data sets, study detailed documentation, and access time-series data.

Open Data

EIA's free and open data available as API, Excel add-in, bulk files, and widgets

EIA Beta

Come test out some of the products still in development and let us know what you think!

Open Source Code

EIA's open source code, available on GitHub.

RSS Feeds

Subscribe to feeds for updates on EIA products including Today in Energy and What's New.