U.S. Energy Information Administration logo
Skip to sub-navigation
August 15, 2012

North Dakota crude oil production continues to rise
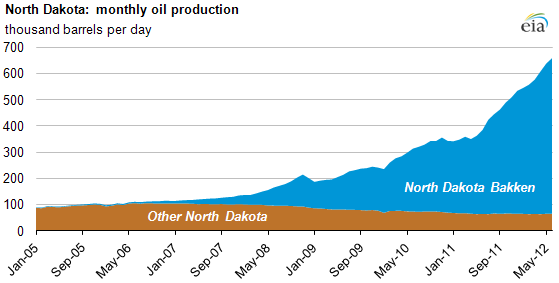
graph of North Dakota monthly oil production, as described in the article text
Source: U.S. Energy Information Administration, based on North Dakota Department of Mineral Resources.
Note: Includes Bakken, Sanish, Three Forks, and Bakken/Three Forks pools.

North Dakota's oil production averaged 660 thousand barrels per day (bbl/d) in June 2012, up 3% from the previous month and 71% over June 2011 volumes. Driving production gains is output from the Bakken formation in the Williston Basin, which averaged 594 thousand bbl/d in June 2012, an increase of 85% over the June 2011 average. The Bakken now accounts for 90% of North Dakota's total oil production.

Production gains in the Bakken formation are the result of accelerated development activity, primarily horizontal drilling combined with hydraulic fracturing. According to the North Dakota Department of Mineral Resources, there were a total of 4,141 producing wells in the North Dakota Bakken in June 2012, up 4% from May 2012 and up 68% from the number of producing wells in June 2011.

Increasing oil rig counts underscore the quickening pace of drilling in the region. Data from Baker Hughes show that in the Williston Basin, the average weekly count of actively drilling horizontal rigs totaled 209 in June 2012, essentially unchanged from the May 2012 average but 26% above the June 2011 average (see below). Most of these rigs are positioned in the Bakken.
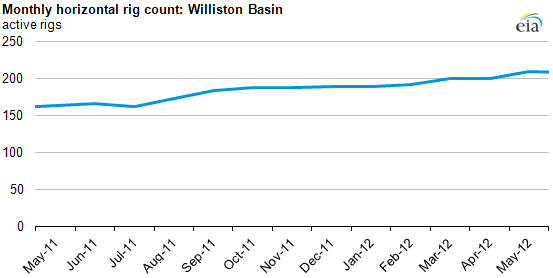
graph of Monthly rig count: Williston Basin, as described in the article text
Source: U.S. Energy Information Administration, based on Baker Hughes.

The transportation system—oil pipelines, truck deliveries, and rail—to move crude oil out of the area is being affected by constraints due to growth in crude oil production from the Bakken formation. As a result of these bottlenecks, the difference between spot prices for Bakken crude oil and West Texas Intermediate (WTI) crude oil expanded through much of the first quarter of 2012. The spread has generally narrowed in recent weeks, however, reflecting the addition of rail transport facilities and increased refinery capacity in the Bakken area.

Statistics
Analysis
Tools
Education
News

Petroleum & Other Liquids

Crude oil, gasoline, heating oil, diesel, propane, and other liquids including biofuels and natural gas liquids.

Natural Gas

Exploration and reserves, storage, imports and exports, production, prices, sales.

Electricity

Sales, revenue and prices, power plants, fuel use, stocks, generation, trade, demand & emissions.

Coal

Reserves, production, prices, employment and productivity, distribution, stocks, imports and exports.

Nuclear & Uranium

Uranium fuel, nuclear reactors, generation, spent fuel.

Renewable & Alternative Fuels

Includes hydropower, solar, wind, geothermal, biomass and ethanol.

EIA Survey Forms

Forms EIA uses to collect energy data including descriptions, links to survey instructions, and additional information.

Total Energy

Comprehensive data summaries, comparisons, analysis, and projections integrated across all energy sources.

U.S. States

State energy information, including overviews, rankings, data, and analyses.

International

International energy information, including overviews, rankings, data, and analyses.

Environment

Greenhouse gas data, voluntary reporting, electric power plant emissions.

Data Tools, Apps, & Maps

Tools to customize searches, view specific data sets, study detailed documentation, and access time-series data.

Open Data

EIA's free and open data available as API, Excel add-in, bulk files, and widgets

EIA Beta

Come test out some of the products still in development and let us know what you think!

Open Source Code

EIA's open source code, available on GitHub.

RSS Feeds

Subscribe to feeds for updates on EIA products including Today in Energy and What's New.