
In 2025, U.S. natural gas spot prices increased from 2024’s record low
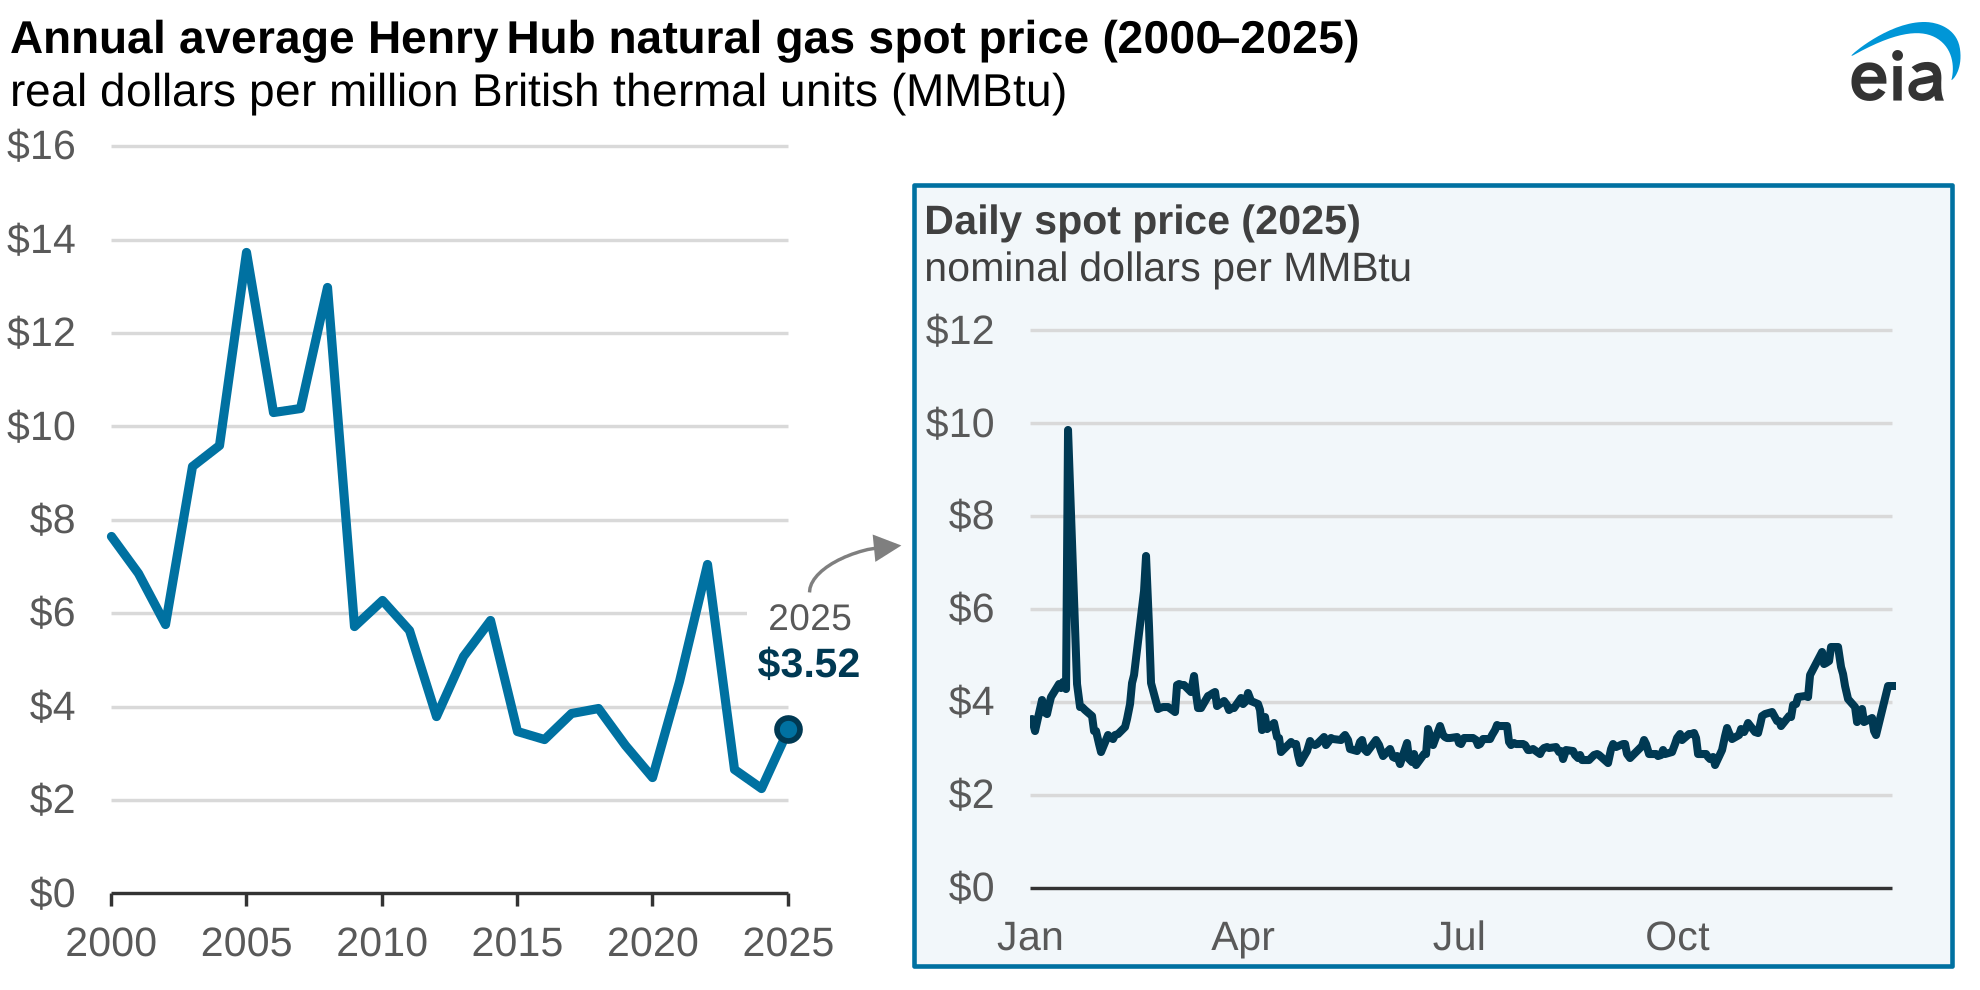
Data values: Henry Hub Natural Gas Spot Price adjusted for inflation using the GDP Implicit Price Deflator
In 2025, the wholesale U.S. natural gas spot price at the national benchmark Henry Hub in Louisiana averaged $3.52 per million British thermal units (MMBtu), based on data from LSEG Data. The 2025 average Henry Hub natural gas spot price increased 56% from the 2024 annual average, which—when adjusted for inflation—was the lowest on record. On a daily basis, the Henry Hub natural gas spot price ranged from $2.65/MMBtu to $9.86/MMBtu, reflecting a narrower range of daily prices compared with the previous year.
Natural gas prices tend to be higher in winter months, when colder winter temperatures lead to more demand for natural gas, both directly for space heating and indirectly because natural gas is also the most prevalent source of electricity generation in the United States. Demand for U.S. liquefied natural gas exports (LNG) also rose by an estimated 3 billion cubic feet per day (Bcf/d) in 2025 as U.S. LNG export capacity increased.
Lower prices over the summer were driven by record high production, which increased by an estimated 4.5 Bcf/d, and less natural gas consumption in the electric power sector. Natural gas spot prices gradually rose in the final months of 2025 because of factors such as a polar vortex event in late November and early December, which briefly pushed prices above $5.00/MMBtu.
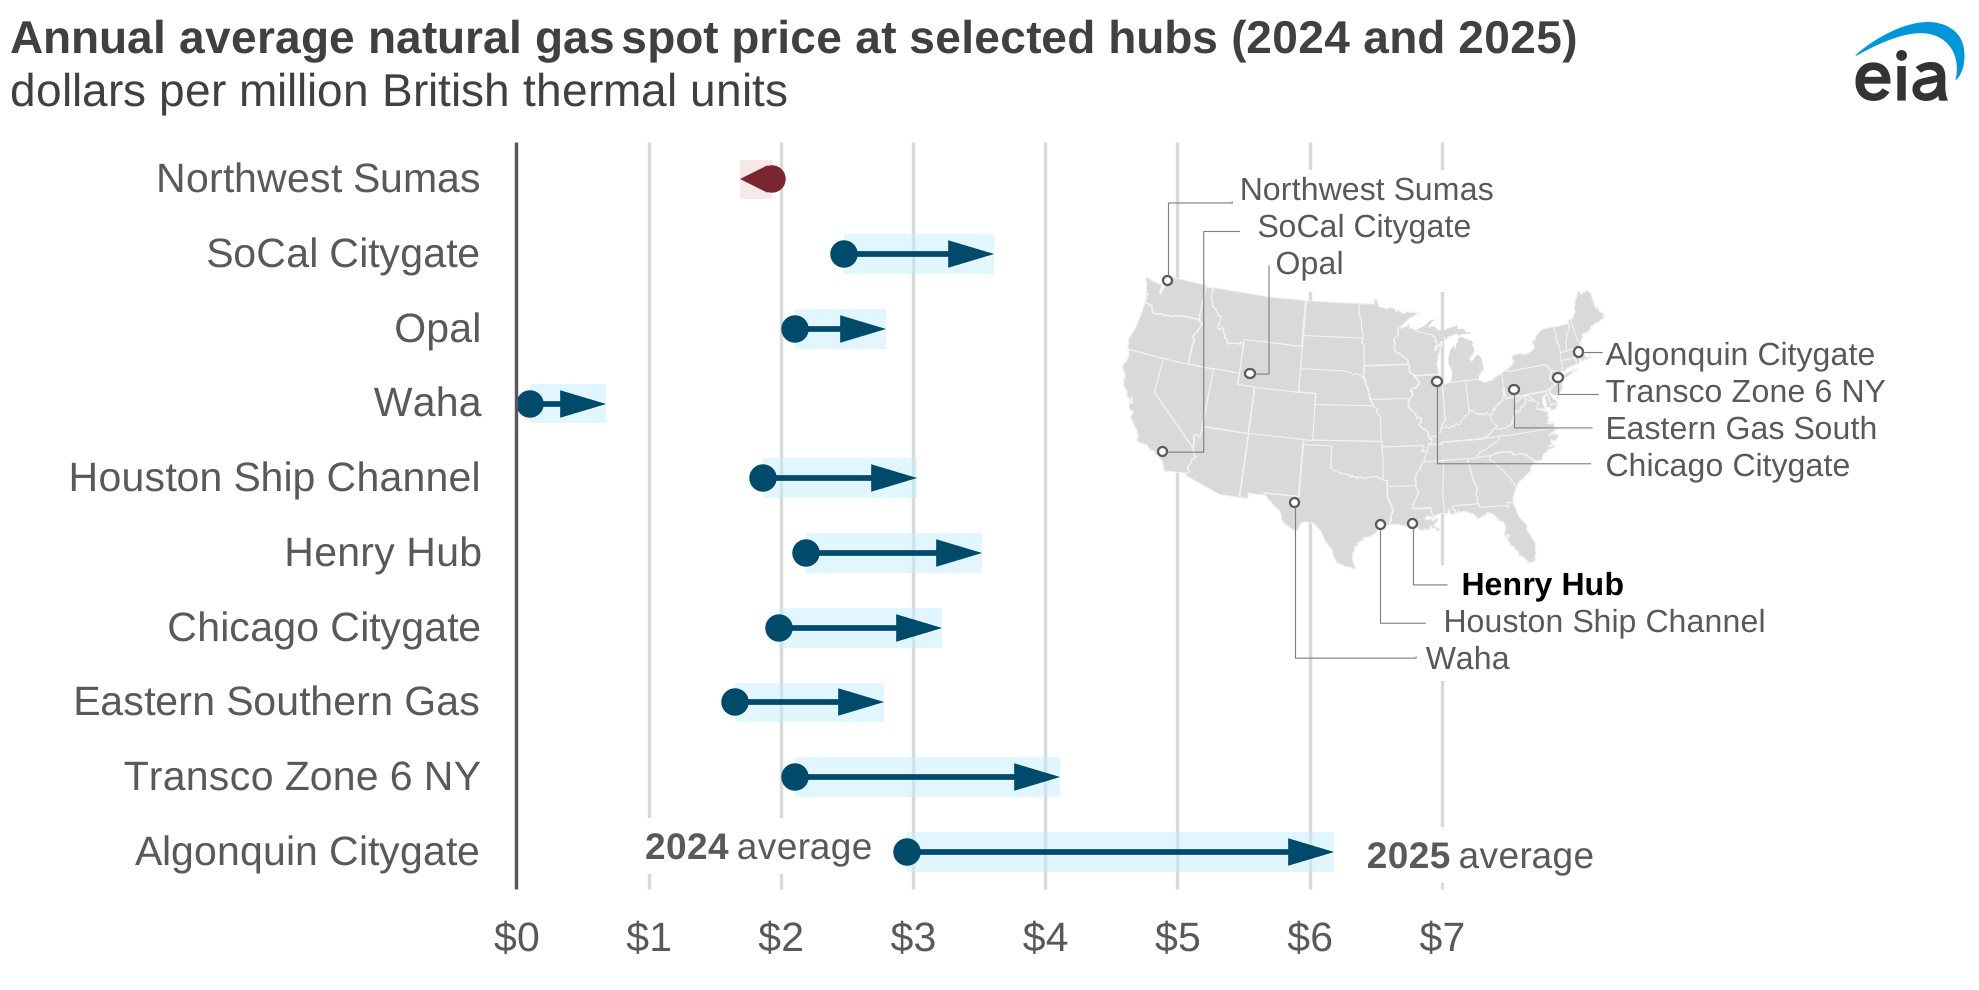
U.S. natural gas spot prices at most major trading hubs increased in 2025, except at the Northwest Sumas point near the U.S.-Canada border. Two hubs in the Northeast—Algonquin Citygate near Boston and Transco Zone 6 NY near New York City—had price increases that were much more than Henry Hub’s $1.33/MMBtu increase in 2025, according to data from Natural Gas Intelligence.
In the Northwest, the annual average natural gas spot price at Northwest Sumas fell by $0.24/MMBtu in 2025 as ample natural gas supply from Canada coincided with less demand for natural gas-fired electricity in the Pacific Northwest region. Natural gas production in Western Canada set record highs last year, led by the Montney, a shale basin in British Columbia and Alberta.
In the Northeast, natural gas spot prices in New York (Transco Zone 6 NY) and New England (Algonquin Citygate) surged in early 2025, primarily driven by colder temperatures and supply constraints within the region’s pipeline network. Natural gas prices at the Algonquin Citygate averaged $16.37/MMBtu in January and $14.00/MMBtu in February, the highest prices for these months since 2022, coinciding with a polar vortex event. Spot natural gas prices in the Northeast tend to be more volatile during winter months when rising regional natural gas demand leads to more congestion on the natural gas pipeline network.
Principal contributor: Andrew Iraola
Tags: natural gas, spot prices