
U.S. natural gas consumption set new winter and summer monthly records in 2024
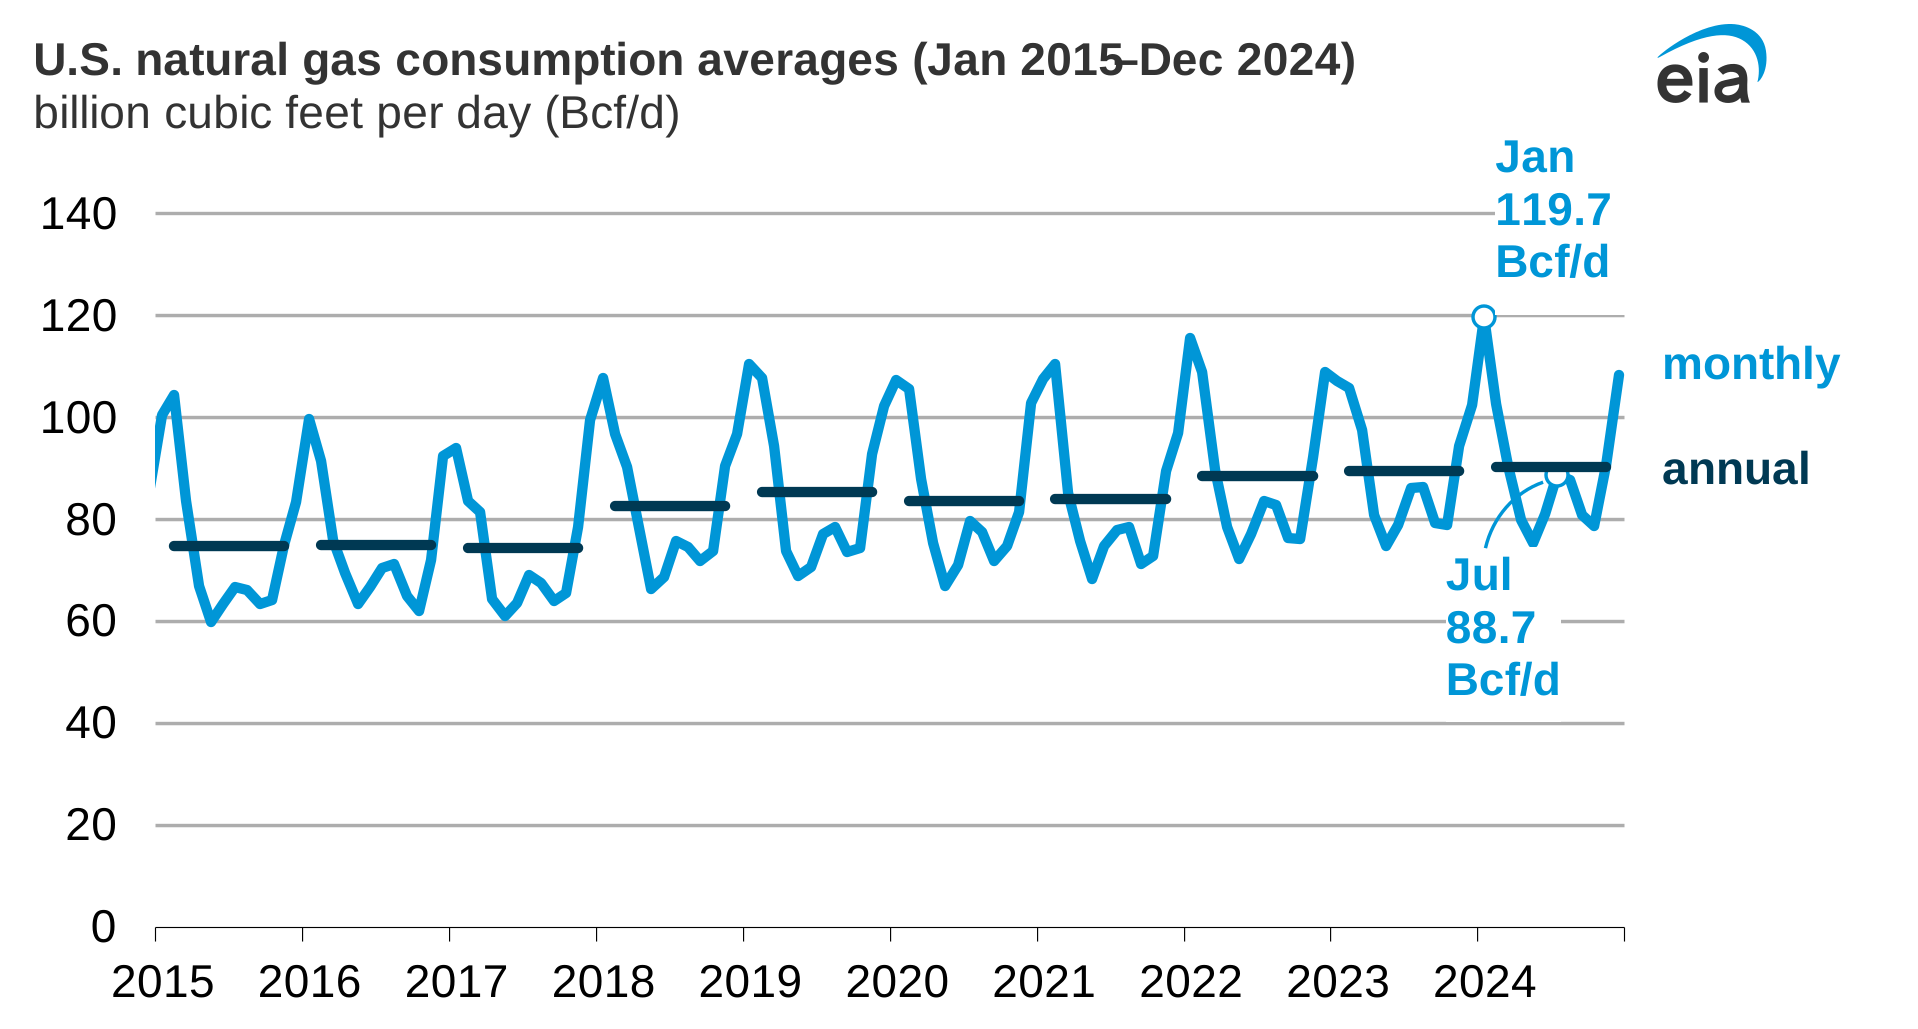
In 2024, U.S. natural gas consumption averaged a record 90.3 billion cubic feet per day (Bcf/d) and set new winter and summer monthly records in January and July, according to data in our Natural Gas Monthly. Overall, U.S. consumption last year increased 1% (0.9 Bcf/d) from 2023. In January, natural gas consumption was up 12% (12.5 Bcf/d) compared with January 2023 consumption, and in July, consumption increased by 3% (2.5 Bcf/d) compared with July 2023.
Weather has a significant effect on natural gas consumption patterns. Natural gas consumption peaks in the United States in both the winter and summer. In winter, the most natural gas is consumed in January or February, when demand for space heating in the residential and commercial sectors peaks. In the summer, electricity generation increases in July and August to meet air-conditioning demand, driving more natural gas consumption.
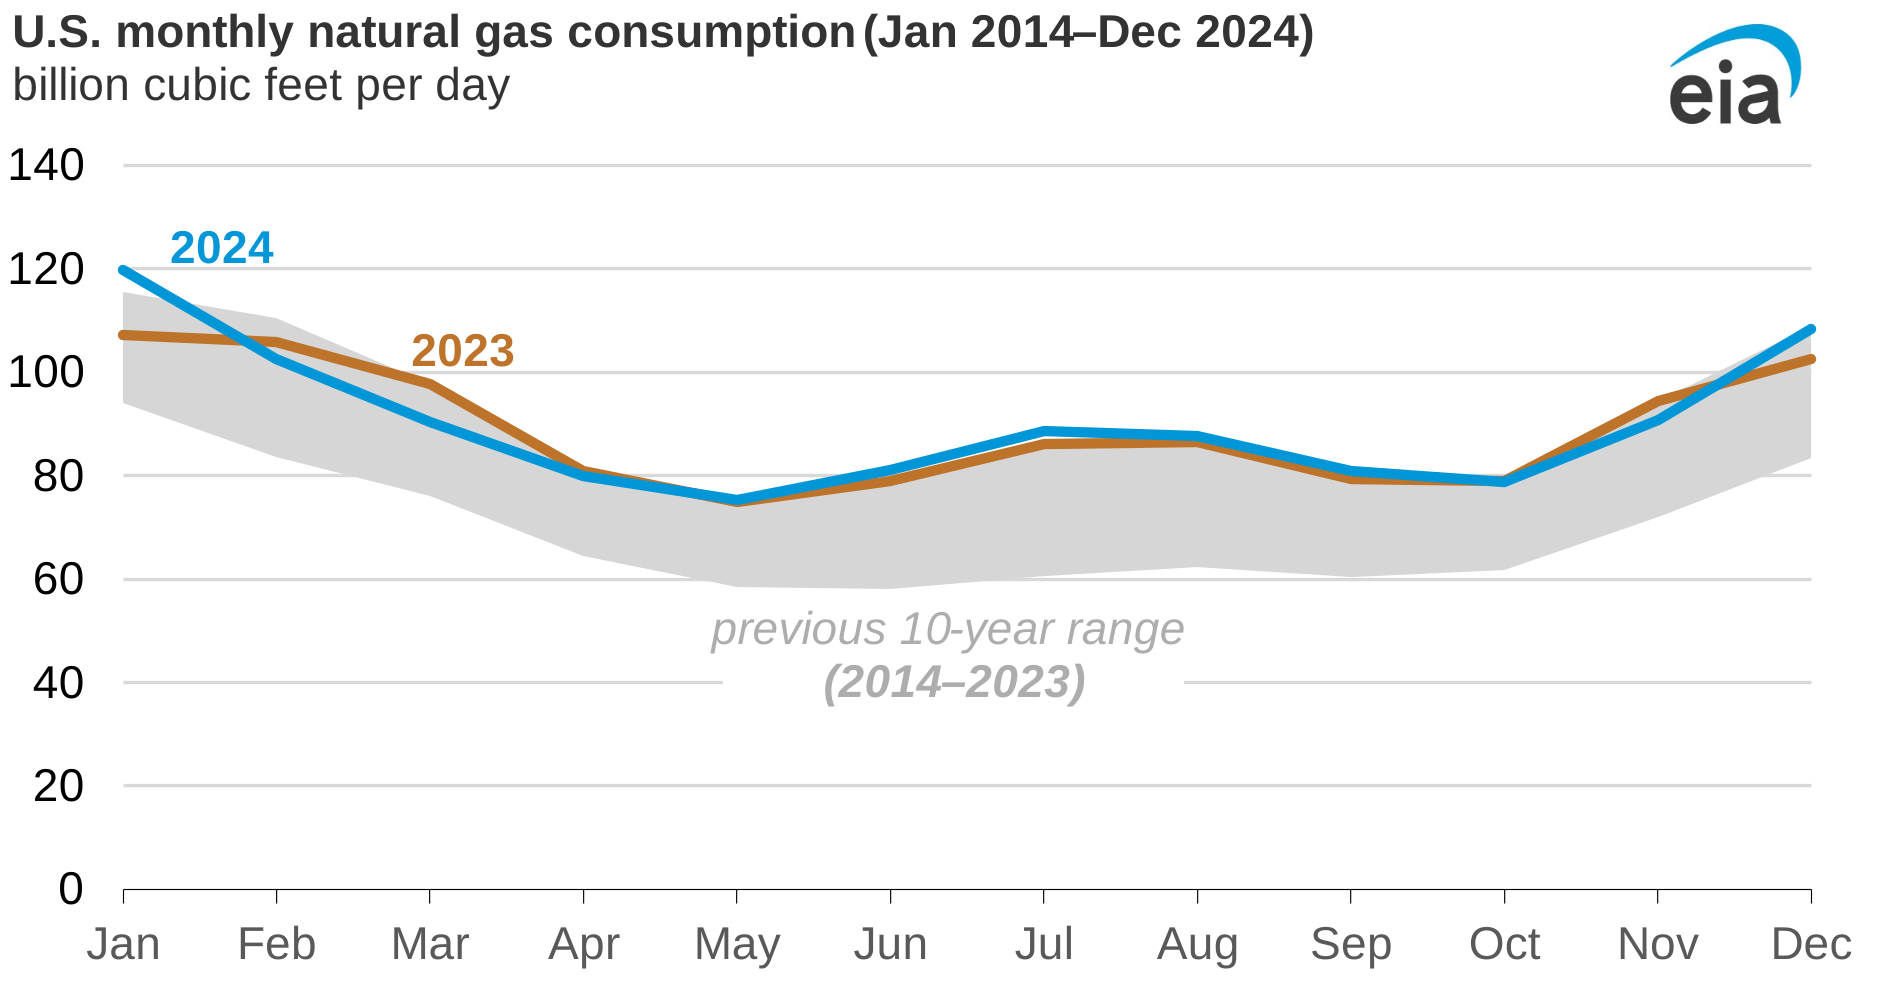
Despite the record in January, from February through April 2024, mild weather led to less consumption of natural gas compared with the same months in 2023. In each month from May through September 2024, natural gas consumption surpassed the previous year’s monthly records. Historic low natural gas prices in 2024 meant that natural gas was more competitive in the electric power sector, especially compared with coal, contributing to increased use of natural gas for electricity generation.
Annual consumption in the combined residential and commercial sectors declined by an average of 2% (0.4 Bcf/d) last year compared with 2023, despite a cold January that resulted in record-high natural gas consumption in these sectors. Natural gas consumed in the industrial sector held steady from the year before, while consumption in the electric power sector, which accounted for 41% of U.S. natural gas consumption in 2024, increased by 4% (1.6 Bcf/d).
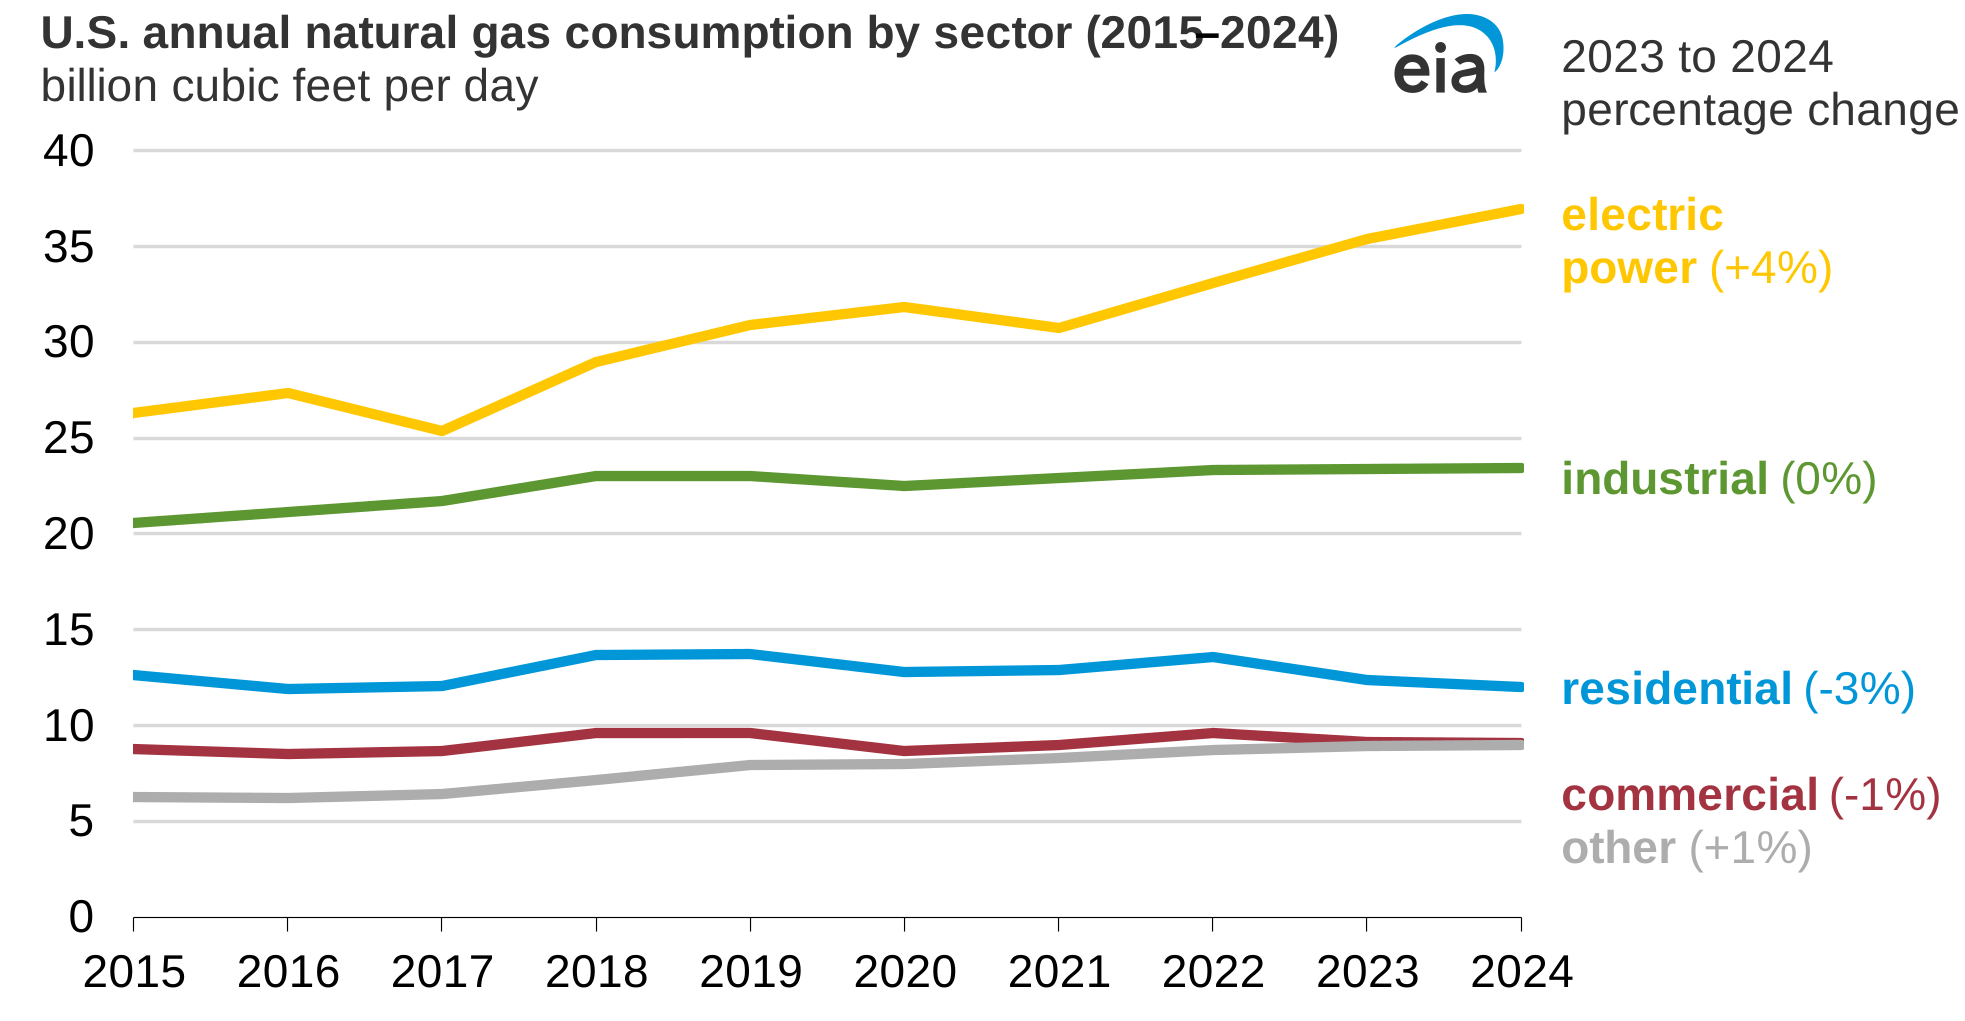
Note: Other=natural gas volumes consumed as transportation fuel, as lease and plant fuel, and in pipeline and distribution use
The summer of 2024 (June–August) ranked as the fourth-warmest on record in the U.S. Lower 48 states, leading to strong demand for air conditioning and resulting in new daily records for electricity generation in July and August. As a result, natural gas consumption in the electric power sector rose in July and August to be the highest ever recorded for the summer.
Principal contributors: Jordan Young, Katy Fleury
Tags: natural gas, consumption/demand, weather