Major U.S. utilities spending more on electricity delivery, less on power production
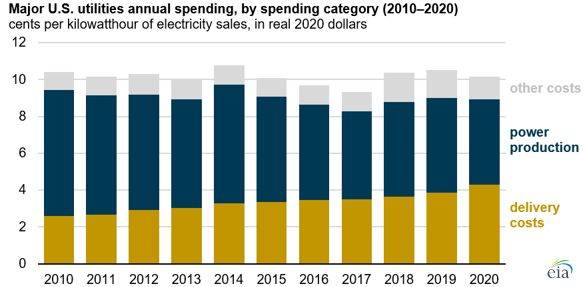
Over the past decade, major utilities in the United States have been spending more on delivering electricity to customers and less on producing that electricity.
After adjusting for inflation, major utilities spent 2.6 cents per kilowatthour (kWh) on electricity delivery in 2010, using 2020 dollars. In comparison, spending on delivery was 65% higher in 2020 at 4.3 cents/kWh. Conversely, utility spending on power production decreased from 6.8 cents/kWh in 2010 (using 2020 dollars) to 4.6 cents/kWh in 2020.
Utility spending on electricity delivery includes the money spent to build, operate, and maintain the electric wires, poles, towers, and meters that make up the transmission and distribution system. In real 2020 dollar terms, spending on electricity delivery increased every year from 1998 to 2020 as utilities worked to replace aging equipment, build transmission infrastructure to accommodate new wind and solar generation, and install new technologies such as smart meters to increase the efficiency, reliability, resilience, and security of the U.S. power grid.
Spending on power production includes the money spent to build, operate, fuel, and maintain power plants, as well as the cost to purchase power in cases where the utility either does not own generators or does not generate enough to fulfill customer demand. Spending on electricity production includes the cost of fuels, capital, labor, and building materials, as well as the type of generators being built.
Other utility spending on electricity includes general and administrative expenses, general infrastructure such as office space, and spending on intangible goods such as licenses and franchise fees.
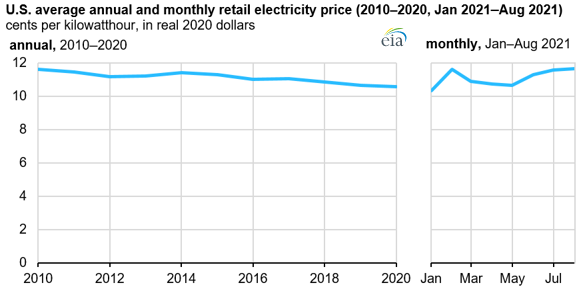
The retail price of electricity reflects the cost to produce and deliver power, the rate of return on investment that regulated utilities are allowed, and profits for unregulated power suppliers.
In 2021, demand for consumer goods and the energy needed to produce them has been outpacing supply. This difference has contributed to higher prices for fuels used by electric generators, especially natural gas. The increased cost for fuel, capital, labor, and building materials, as seen in the U.S. Bureau of Labor Statistics’ Producer Price Index, is increasing the cost of power production for 2021. U.S. average electricity prices have been higher every month of this year compared with 2020, according to our Monthly Electric Power Industry Report.
Principal contributor: Lori Aniti
Tags: production/supply, electricity, utility