
EIA forecasts U.S. winter natural gas bills will be 30% higher than last winter
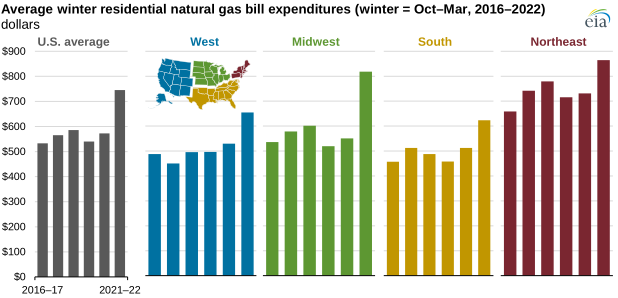
In our latest Winter Fuels Outlook, we forecast that U.S. households that primarily use natural gas for space heating will spend an average of $746 on heating this winter (October–March), which is $172, or 30%, more than last year.
Natural gas is the primary heating fuel for 48% of U.S. homes, according to the U.S. Census Bureau’s 2019 American Community Survey. Residential spending on winter natural gas bills is largely determined by the retail price of natural gas and the amount of natural gas consumed.
Higher retail natural gas prices are the primary driver for the expected increase in natural gas heating expenditures this winter. On average, retail natural gas prices in the United States are expected to rise from $10.17 per thousand cubic feet (Mcf) last winter to $12.93/Mcf this winter, the highest price since the 2005–06 winter average. We expect the largest increase in retail natural gas prices to occur in the Midwest, where prices rise to $11.28/Mcf, a 45% increase compared with last winter.
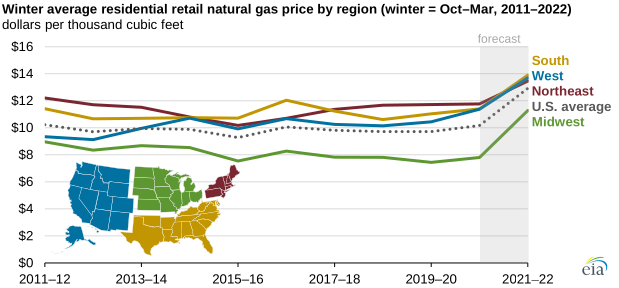
The increase in retail prices reflects rising natural gas spot prices over the past year. Changes in natural gas spot prices typically get passed along to retail rates over a period of months because of regulatory rate structures. Utilities generally cannot profit or lose money from natural gas commodity sales, whose costs are passed along directly to the consumer.
In addition to the steady rise in natural gas spot prices over the past year, many utilities had to raise prices for consumers following the February 2021 cold snap that affected most of the country, but particularly Texas and the Midwest. During the cold snap, many utilities had to purchase natural gas at spot prices that were higher than anticipated. However, because retail rates were already set for the month, utilities did not collect enough to cover the cost of the natural gas. To make up for this undercollection, many utilities opted to raise prices in subsequent months to spread out the costs to consumers over several months.
Higher-than-expected natural gas expenditures this winter also result from slightly higher-than-expected consumption compared with last year. For households that use natural gas as their primary space heating fuel, we expect average consumption this winter to be 57.7 Mcf, a 2.4% increase from last winter. The higher consumption is driven by a 2.6% forecast increase in the number of heating degree days (a measure of heating demand) compared with last winter. In our October Short-Term Energy Outlook (STEO), we estimate that U.S. natural gas inventories ended September at 3,304 Bcf, which is 5.5% below the five-year average for this time of year.
Principal contributors: Corrina Ricker, Stephen York
Tags: prices, residential, forecasts/projections, natural gas, weather