
U.S. natural gas prices likely to remain elevated through the winter
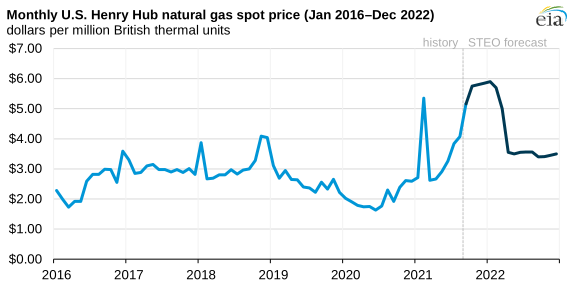
In our October Short-Term Energy Outlook (STEO), we forecast that natural gas spot prices at the U.S. benchmark Henry Hub will average $5.67 per million British thermal units (MMBtu) between October and March, the highest winter price since 2007–2008. The increase in Henry Hub prices in recent months and in our forecast reflect below-average storage levels heading into the winter heating season and strong demand for U.S. liquefied natural gas (LNG), even though we’ve seen relatively slow growth in U.S. natural gas production. We expect Henry Hub prices will decrease after the first quarter of 2022, as production growth outpaces growth in LNG exports, and will average $4.01/MMBtu for the year.
U.S. exports of LNG are establishing a record high this year, and we expect them to set a new record high next year. We expect LNG exports to average 9.7 billion cubic feet per day (Bcf/d) this year (3.2 Bcf/d more than the 2020 record high of 6.5 Bcf/d) and to exceed annual pipeline exports of natural gas for the first time. The year-on-year increase in LNG exports coincides with slight growth in U.S. natural gas production. We expect U.S. dry natural gas production to average 92.6 Bcf/d this year, which is 1.1 Bcf/d more than in 2020 but 0.3 Bcf/d less than in 2019.
Because U.S. LNG exports have grown faster than domestic natural gas production, inventories are lower than average. As of the end of September, we estimate that total U.S. natural gas inventories are 5.5% below the five-year (2016–2020) average. We forecast that U.S. inventories of natural gas will begin the winter heating season on November 1 at 3,572 Bcf, or 4.8% below the five-year average. Lower U.S. inventories could contribute to more natural gas price volatility, particularly if any area in the United States experiences a severe cold snap, which makes the price outlook for this winter very uncertain.
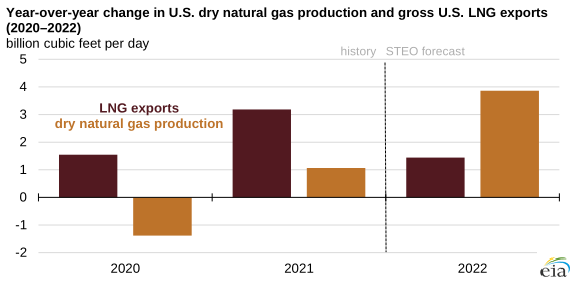
Note: The annual average for liquefied natural gas (LNG) in 2021 includes forecast values from the STEO for October–December, and the dry natural gas production annual average for 2021 includes forecast values from the STEO for August–December.
In the second quarter of 2022, we forecast decreasing Henry Hub natural gas prices as anticipated growth in domestic natural gas production begins to outpace growth in U.S. LNG exports. We expect U.S. production to average 96.4 Bcf/d in 2022, or 3.9 Bcf/d more than in 2021, and U.S. LNG exports to rise by a smaller amount, 1.4 Bcf/d, during this time period. We forecast that faster growth in production will put downward pressure on natural gas prices.
Principal contributor: Corrina Ricker