
From 1980 to 2010, most regions contributed to growth in global crude oil production
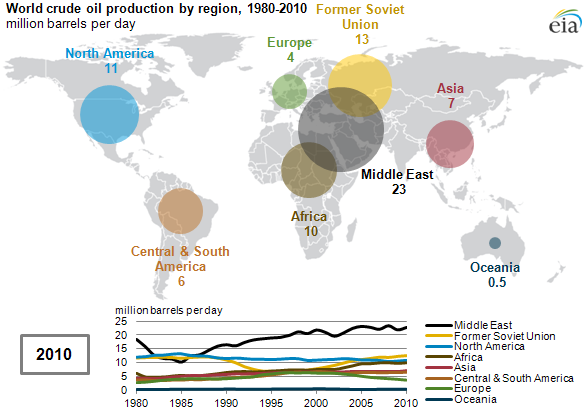
Note: Crude oil production represented by production of crude oil including lease condensate.
Global crude oil and lease condensate production increased 24%, or over 14 million barrels per day (bbl/d), between 1980 and 2010 (click animation above). Although the Middle East was the largest regional producer and grew by 23% over that period, or over 4 million bbl/d, the region's share of global crude oil production was at 31% in both 1980 and 2010. Central & South America, Africa, and Asia grew most rapidly, increasing their combined share of total crude oil production from 23% in 1980 to 32% in 2010.
North America's crude oil production decreased about 1 million bbl/d between 1980 and 2010—the only region with declining crude oil production. As a result, North America's share of global growing oil production fell from 20% in 1980 to 15% in 2010.
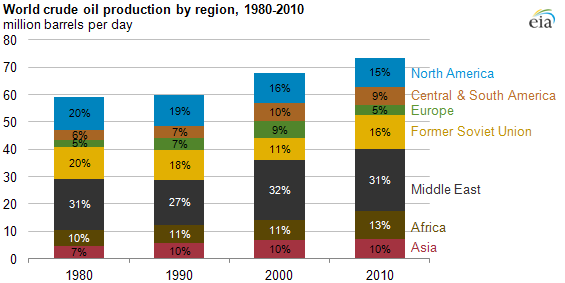
Note: Crude oil production represented by production of crude oil including lease condensate. Percents on graph represent that region's share of global crude oil production in that year. Percents do not sum to 100% for each year because Oceania was not included in the graph, which only accounted for 1% of global production each year.
Download CSV Data
More recently, however, the United States has reversed a decades-long decline in crude oil production. North Dakota and Texas led recent U.S. crude oil production gains. Average annual production, which dipped below 5.0 million bbl/d in 2008, climbed to 5.4 million bbl/d in 2009 and 5.5 million bbl/d in 2010, with 2010 volumes representing an 11% increase over 2008. In October 2011, preliminary data showed that U.S. crude oil production averaged 5.8 million bbl/d.
- North Dakota. According to the North Dakota Department of Mineral Resources (DMR), the state's oil production averaged 488 thousand bbl/d in October 2011, more than four and one-half times its October 2005 level. The DMR reported further increases for November 2011, with production averaging 510 thousand bbl/d. North Dakota currently trails only Texas, Alaska, and California among oil-producing states.
- Texas. Oil production in Texas has also increased in recent years. The state's oil production, which fell by an average of 1.4% annually between 2000 and 2008, increased 1.7% in 2009 and 5.7% in 2010. From January 2011 through August 2011 (the most recent month for which EIA reports data for Texas), oil production averaged 1.35 million bbl/d, up 15.6% from the 2010 daily average.