
In 2019, the United States produced and consumed record volumes of natural gas
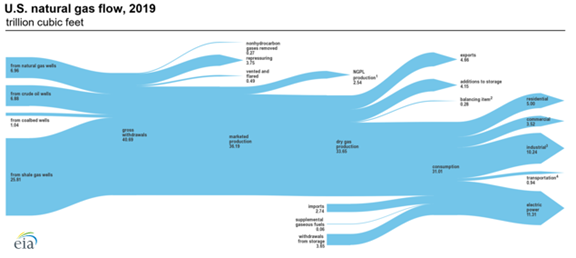
Note: Click for full U.S. natural gas flow 2019 diagram.
Natural gas is one of the main sources of energy in the United States. In 2019, U.S. production of dry natural gas increased to almost 34 trillion cubic feet (Tcf) and consumption increased to 31 Tcf—both values were records. The U.S. Energy Information Administration’s (EIA) U.S. natural gas flow diagram shows the magnitude of U.S. natural gas supply (production, imports, and withdrawals from storage) and disposition (consumption, exports, and additions to storage) in 2019.
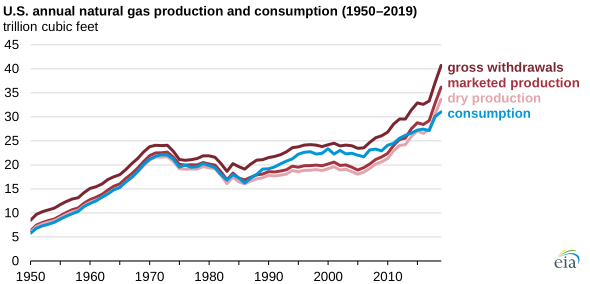
U.S. natural gas production has increased in the past decade because the widespread adoption of horizontal drilling and hydraulic fracturing techniques has allowed operators to more economically produce natural gas from shale formations. In each year since 2017, on an annual basis, production of dry natural gas has exceeded consumption within the United States.
In 2019, gross U.S. withdrawals of natural gas and other compounds extracted at the wellhead totaled nearly 41 Tcf, and most came from shale natural gas wells. Marketed natural gas production, which excludes natural gas used for repressuring wells, vented and flared gas, and nonhydrocarbon gases, totaled more than 36 Tcf. U.S. marketed natural gas was further processed into about 34 Tcf of dry natural gas and about 3 Tcf of natural gas plant liquids, such as ethane and propane.
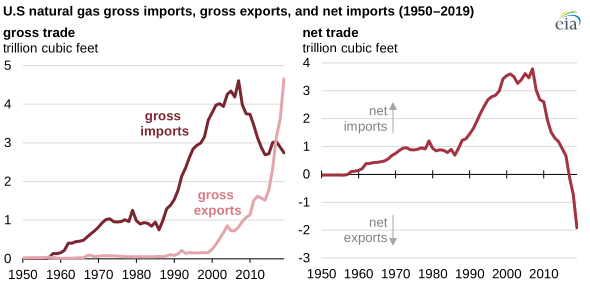
As natural gas production has increased in the United States, exports of natural gas have also increased, surpassing natural gas imports in 2017 for the first time since 1957. In 2019, the U.S. exported a record of nearly 5 Tcf of natural gas, mostly by pipeline to Mexico and Canada or shipped overseas as liquefied natural gas (LNG). Natural gas imports in 2019 were less than 3 Tcf, the lowest level since 2015. Most U.S. natural gas imports originate in Canada.
In the United States, significant amounts of natural gas are also added to or withdrawn from underground storage throughout the year. Natural gas is added, or injected, to storage during periods of low consumption, typically during the spring and fall, and is withdrawn from storage during periods of high consumption, typically in the winter and summer.
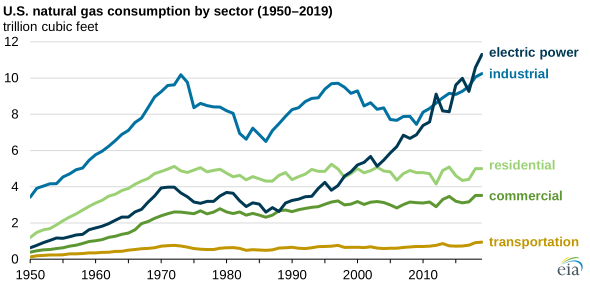
In 2019, more than two-thirds of the dry natural gas consumed in the United States was used by the electric power and industrial sectors. The remaining shares of natural gas were consumed by the residential, commercial, and transportation sectors; exported to other countries; or added to underground storage.
The U.S. electric power sector has been the biggest end user of natural gas in four out of the last five years, after first surpassing the industrial sector in 2012. Natural gas has been the predominant source of electricity generation in the United States since surpassing coal in 2016. U.S. natural gas consumption is nearly evenly split among the electric power sector (36% of total natural gas consumption in 2019); the industrial sector (33%); and the residential, commercial, and transportation sectors (31% combined).
You can find natural gas data in various EIA sources, including:
- Natural Gas Weekly Update, recent production, price, supply, rig count, and storage data
- Weekly Natural Gas Storage Report, EIA’s survey of weekly working gas in underground storage
- Natural Gas Storage Dashboard, visualizes several of the metrics from the Weekly Natural Gas Storage Report
- Drilling Productivity Report, information on natural gas drilling rig efficiency in selected shale regions
- Monthly Crude Oil and Natural Gas Production Report, EIA’s survey of monthly crude oil and natural gas production data
- Monthly and annual natural gas comprehensive reports from EIA’s natural gas industry surveys
- Monthly Energy Review, EIA’s comprehensive source for historical energy data
Principal contributor: Brett Marohl