Investor-owned utilities served 72% of U.S. electricity customers in 2017

According to the U.S. Energy Information Administration’s (EIA) electric power sector survey data, almost 3,000 electric distribution companies—or utilities—were operating in the United States in 2017. EIA classifies utilities into three ownership types: investor-owned utilities, publicly run or managed utilities, and cooperatives. Although there are fewer investor-owned utilities than the other two types of utilities, they tend to be very large. Investor-owned utilities serve three out of every four utility customers nationwide.
Investor-owned utilities, or IOUs, are large electric distributors that issue stock owned by shareholders. Almost three-quarters of utility customers get their electricity from these companies. IOUs are most prevalent in heavily populated areas on the East and West coasts. In 2017, 168 IOUs served an average of 654,600 electric customers. The two largest IOUs are in California: Pacific Gas and Electric, with 5.48 million customers, and Southern California Edison Company, with 5.07 million customers.
Publicly owned utilities, or POUs, include federal-, state-, and municipal-run utilities. In addition to government entities, political subdivisions may run POUs, also called public utility districts—utilities that residents vote into existence that operate independently of city or country government. The United States has 1,958 POUs with an average of 12,100 electricity customers each. The largest POUs are the state-run Puerto Rico Electric Power Authority (PREPA), with 1.47 million customers, and the Los Angeles Department of Water and Power, a municipal utility with 1.43 million customers.
Cooperatives, or co-ops, are not-for-profit member-owned utilities. Co-ops are located in 47 states but are most prevalent in the Midwest and Southeast. The United States has 812 co-ops with an average of 24,500 electricity customers each. The largest co-op is Pedernales Electric Co-op, in Johnson City, Texas, with 333,809 customers, nearly 50% more customers than the second-largest co-op, Jackson Electric Member Corporation, in Jefferson, Georgia.
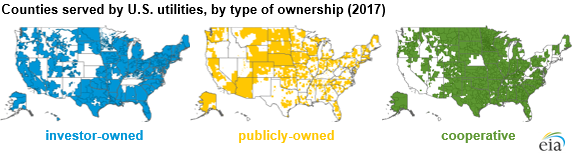
Note: A county may have many utilities types that provide service. Detailed maps are available from the National Rural Electric Cooperative Association (co-ops) and the Edison Electric Institute (an association for IOUs).
Pearl Street Station, built by the Edison Illuminating Company, which was led by Thomas Edison, was the first electric distribution utility in the nation. It began operating in Lower Manhattan, New York, in 1882. Before Pearl Street, Americans who wanted electricity in their homes had to have a generator. This modern electricity distribution method spread to other city centers and densely populated areas.
In smaller cities and towns, local governments began setting up their own electric distribution utilities. By the late 1800s and early 1900s, municipalities ran most utilities, and more than 3,000 existed by 1923. Later, technological improvements in generation and transmission made smaller plants uneconomical, and many cities sold their equipment and transferred their customers to IOUs.
In the mid-1930s, only 10% of homes in the rural United States had electricity. The Rural Electrification Act of 1936 was a federal loan program that provided electricity to rural populations. Farmer cooperatives quickly started forming to bring electricity to communities not covered by IOUs or municipal utilities. Co-ops are still most prevalent in rural areas today.
EIA collects a variety of data from utilities, including data on generating capacity, monthly generation, annual wholesale purchases, monthly sales to ultimate customers, revenues from sales to ultimate customers, and ultimate customer counts. Although fairly stable, the ownership type of a utility may change over time in response to mergers, changing or expanding jurisdiction boundaries, or changes in market conditions.
Principal contributors: Anodyne Lindstrom, Sara Hoff
Tags: electricity, utility