More than 60% of electric generating capacity installed in 2018 was fueled by natural gas
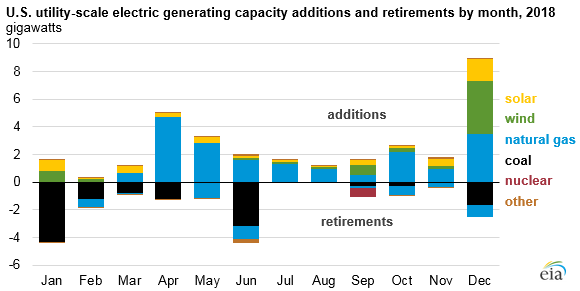
Based on EIA’s December 2018 monthly electric generator inventory of utility-scale generation, 31.3 gigawatts (GW) of generating capacity were added in the United States in 2018 and 18.7 GW of capacity were retired. The 2018 annual capacity additions were the largest since 48.8 GW were added in 2003. Most of the additions happened in the second half of the year, while the retirements occurred mostly in the first half.
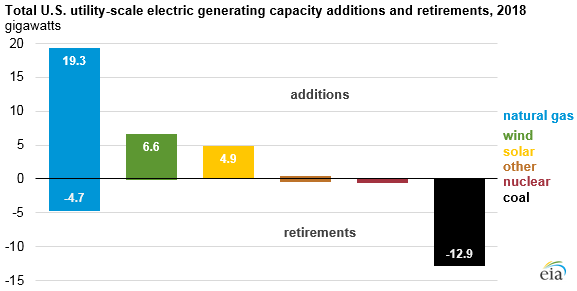
U.S. utility-scale additions in 2018 primarily consisted of natural gas (62%), wind (21%), and solar photovoltaic (16%) capacity. The remaining 2% of additions came primarily from hydroelectric and battery storage capacity.
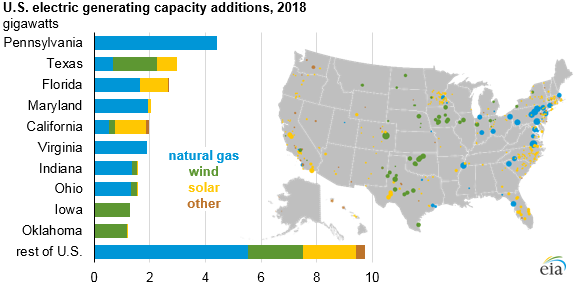
- Natural gas. Almost 90% of the 19.3 GW of the natural gas-fired capacity in the United States added in 2018 were combined-cycle generators, the most efficient natural gas-fired generating technology. Pennsylvania accounted for almost 25% (4.4 GW) of all 2018 domestic natural gas additions, and three other states—Maryland, Virginia, and Florida—accounted for about 30%.
- Wind. In 2018, 6.6 GW of wind capacity came online, almost 60% (3.8 GW) of which was added in December. Texas, Iowa, and Oklahoma added a combined 4.0 GW of wind capacity, more than 60% of total U.S. wind additions.
- Solar. About 60% of the 4.9 GW of U.S. solar photovoltaic (PV) additions in 2018 occurred in California (1.1 GW), Florida (1.0 GW), and North Carolina (0.6 GW). These numbers only represent utility-scale solar and do not include small-scale PV.
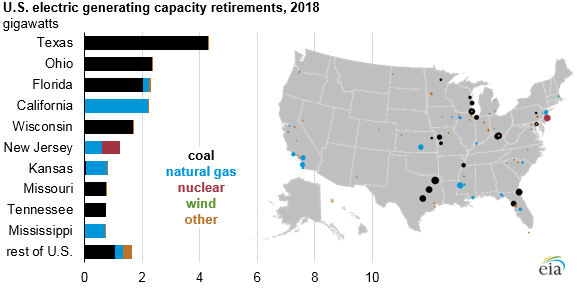
The 18.7 GW of U.S. generating capacity that retired in 2018 were primarily coal (69%), natural gas (25%), and nuclear (3%) generators, with the remainder composed mostly of hydroelectric and petroleum generating capacity.
- Coal. A total of 12.9 GW of coal-fired capacity was retired in 2018. Nearly 80% of coal retirements came from units located in only four states—Texas (4.3 GW), Ohio (2.3 GW), Florida (2.0 GW), and Wisconsin (1.7 GW).
- Natural gas. Although 4.7 GW of U.S. natural gas-fired capacity retired in 2018, 93% (4.4 GW) of those retirements were from natural gas steam and combustion turbine units, which are less efficient natural gas-fired generating technologies that typically operate at lower capacity factors than more efficient combined-cycle units.
- Nuclear. New Jersey was the only state to retire nuclear capacity, retiring 0.6 GW of capacity when the Oyster Creek plant retired in September 2018.
Principal contributor: Kenneth Dubin
Tags: coal, electricity, natural gas, renewables, retirements, wind, hydroelectric, solar, capacity