Regional variations in household lighting consumption driven by bulb choice and bulb count
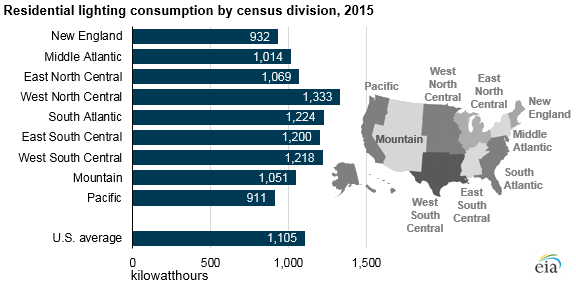
U.S. households consumed an average of 1,105 kilowatthours (kWh) of electricity for lighting in 2015, or about 10% of electricity consumption in homes. Data from EIA’s latest Residential Energy Consumption Survey (RECS) show that average lighting consumption varied geographically from a high of 1,333 kWh per home in the West North Central states of the Midwest to 911 kWh in the Pacific states along the West Coast.
EIA estimates household lighting consumption data based on models supported by household survey responses and energy bills. Key model inputs include the reported number of bulbs, hours of usage, and types of bulbs. Of these factors, types and number of bulbs explain most of the variations in consumption across census divisions. Reported hours of usage are approximately the same throughout the country.
EIA conducted the most recent RECS survey in 2015, a time of transition for the U.S. lighting market. Federal efficiency standards for general service light bulbs were phased in from 2012 through 2014, so consumers purchasing bulbs in those years were likely transitioning from relatively inefficient incandescent bulbs to more efficient options such as halogen, compact fluorescent (CFL), and light-emitting diode (LED) bulbs.
Households with fewer incandescent bulbs tended to have lower-than-average lighting consumption. Similarly, households reporting lower bulb counts had lower lighting consumption. For the 2015 RECS, bulb counts were determined based on household reports. Each household respondent estimated the number of bulbs as a categorical response (fewer than 20, 20 to 39, 40 to 59, etc.), and those categorical responses were then used to estimate bulb counts. Overall, 25% of RECS households reported having 40 or more bulbs.
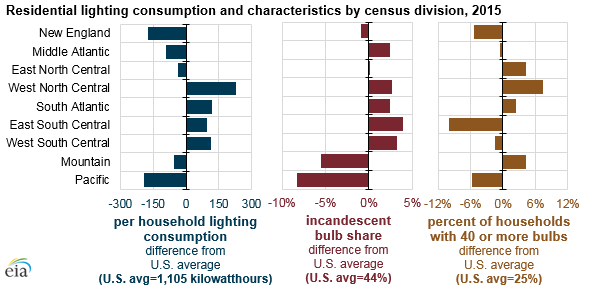
Average lighting consumption was lowest for homes in the Pacific division, where 35% of indoor bulbs were reported as incandescent, nine percentage points less than the national average. Pacific division households also reported lower bulb counts. By comparison, households in the Mountain division, where lighting consumption was closer to the national average, also reported lower-than-average use of incandescent bulbs (38%) but much higher bulb counts.
Average lighting consumption was highest for homes in the West North Central division, where households had a higher-than-average share of incandescent bulbs (46%) and the highest share of homes with 40 or more bulbs. In contrast, households in the Middle Atlantic division reported about the same share of incandescent bulbs (46%), yet they consumed less electricity for lighting than the U.S. average, partly as a result of their lower-than-average bulb counts.
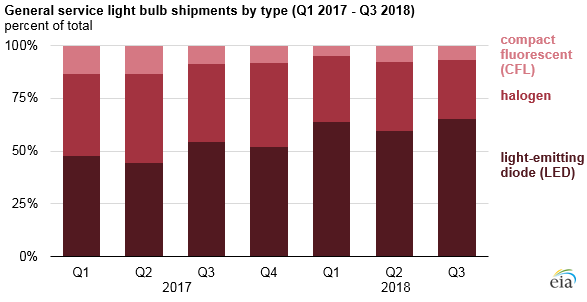
Since 2015, the lighting market has continued to evolve in the United States. The most recent estimates of U.S. bulb shipments from the National Electrical Manufacturers Associations (NEMA) indicate that in the third quarter of 2018, general service LED bulbs accounted for 65% of bulb shipments, halogen bulbs 28%, and CFL bulbs 7%. Traditional incandescent general service bulbs are no longer available in U.S. stores.
Principal contributors: Greg Lawson, Chip Berry