Natural gas and renewables make up most of 2018 electric capacity additions
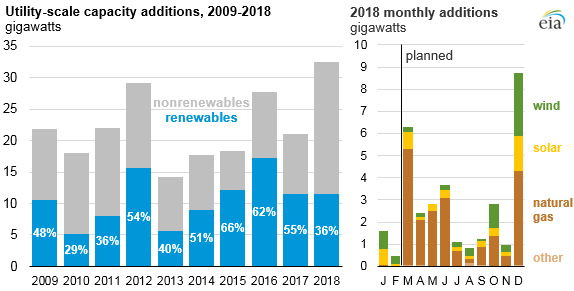
EIA expects nearly 32 gigawatts (GW) of new electric generating capacity will come online in the United States in 2018, more than in any year over the past decade. Although renewables such as wind and solar accounted for 98% of the 2 GW added so far this year (based on data for January and February), EIA expects about 21 GW of natural gas-fired generators will come online in 2018. If these generators come online based on their reported timelines, 2018 will be the first year since 2013 in which renewables did not make up a majority of added capacity.
In 2017, renewables accounted for 55% of the 21 GW of U.S. capacity additions, the fourth consecutive year in which renewables made up more than half. As of February 2018, renewables accounted for 22% of total currently operating U.S. electricity generating capacity. Generators’ planned online dates for the remainder of 2018 are based on data reported to EIA in the Preliminary Monthly Electric Generator Inventory.
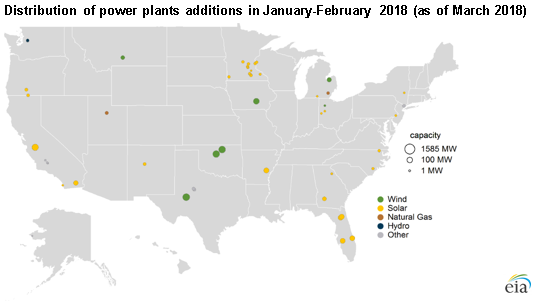
The newly added generating capacity in January and February 2018 included 2,029 megawatts (MW) of renewables, 27 MW of fossil fueled generators, and 28 MW of other technologies, mostly consisting of energy storage batteries. In February 2018, for the first time in decades, all of the new generating capacity coming online within a month were non-fossil-fueled. Of the 475 MW of capacity that came online in February, 81% was wind, 16% was solar photovoltaic, and the remaining 3% was hydro and biomass.
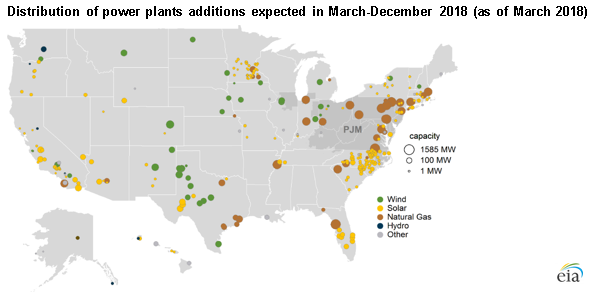
Natural gas. About half of the 21 GW of natural gas-fired generation capacity EIA expects to come online by the end of 2018 are combined-cycle units to be added to the PJM Regional Transmission Organization, which spans parts of several Mid-Atlantic and Midwestern states. In the PJM region, Pennsylvania plans to add 5.2 GW; Maryland will add 1.9 GW, and Virginia will add 1.9 GW. Most of the new capacity is being added on the eastern side of the PJM region along the Transcontinental, the Dominion Transmission, and the Texas Eastern Transmission pipelines.
Wind. Most of the 1,196 MW of new wind capacity that came online in January and February 2018 was added in states that already have significant wind capacity such as Texas, Oklahoma, and Iowa. In Texas, two utility-scale batteries totaling 20 MW were colocated at wind facilities. EIA expects five gigawatts of capacity to come online by the end of 2018. Of those 5 GW, 2 GW are in Texas, the state with the most wind capacity currently.
Solar. About 90% of Florida’s solar capacity has come online since 2016. In January 2018, Florida Power & Light (FPL) completed four solar photovoltaic projects totaling 300 MW. FPL plans for another four projects totaling 300 MW to have come online by March 2018. Upon completion, these eight projects will account for 54% of Florida’s utility-scale solar capacity. By the end of 2018, 4 GW of solar PV are expected to come online in the United States. More than half of the 2018 solar PV additions will be added in California, North Carolina, and Texas.
Principal contributor: Ray Chen
Tags: capacity, electricity, map, natural gas, renewables, solar, states, wind