
With low oil prices in 2016, federal revenues from energy on federal lands again declined
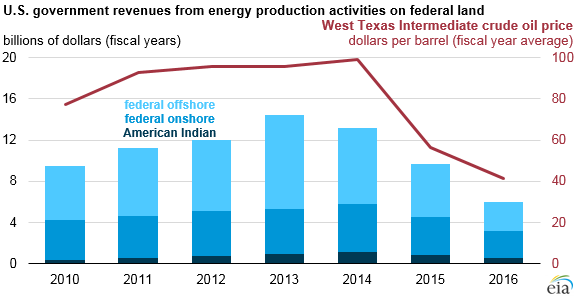
In fiscal year (FY) 2016, the U.S. government collected almost $6 billion in revenues from royalties, rental costs, and other fees from activities related to energy production on federal and American Indian lands, according to the Department of Interior’s Office of Natural Resource Revenue. These activities include the production of coal, oil, natural gas, and hydrocarbon gas liquids (HGLs) as well as, more recently, renewables.
From FY2010 to FY2013, federal revenues increased, driven by growth in offshore and onshore revenue during a time of relatively high oil prices. Revenues in FY2013 exceeded $14 billion and have since decreased in each successive year. Revenues in FY2016 were the lowest since at least FY2004.
Royalties accounted for 86% of total FY2016 revenue ($5.1 billion) from energy production on federal lands. Royalties are based on the amount of a resource produced and its value. As prices change, royalty revenue also fluctuates.
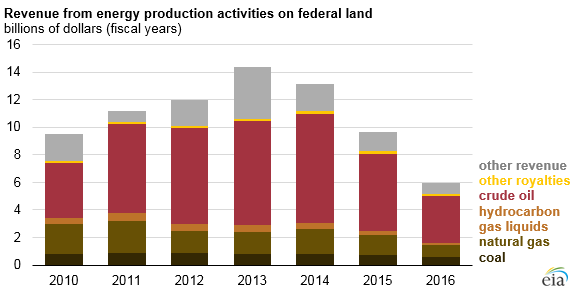
Royalties from crude oil accounted for 55% of the total revenue collected by the U.S. government from activities related to energy production on federal lands from FY2010 to FY2016. Despite growing oil production, revenue has decreased since FY2014 as the price of oil has fallen along with the valuation used to determine royalties. Natural gas, including hydrocarbon gas liquids in the raw natural gas stream, made up an additional 20% of total revenue since 2010, and decreases in the price of natural gas since early 2014 also affecting total royalties. Royalties from coal production contributed an average of 7% of total revenues over this period.
Most of the remaining revenue came from rent on leases of public land (paid annually), fees, and bonuses (a one-time payment paid upon winning a bid), mostly from production of fossil fuels. Royalties and rents from other resources, which includes renewables like geothermal generation and wind energy, were about 1% of total revenue from 2010 through 2016.
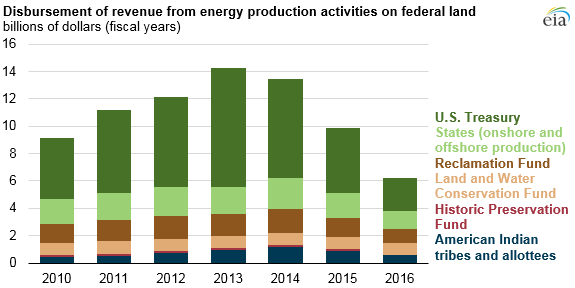
Federal royalties collected from energy production are distributed among federal, state, and other funds. In FY2016, the U.S. Treasury was the largest recipient, receiving $2.4 billion. States also receive a share from onshore production and offshore production based on the activities occurring in each state. Thirty-seven states collectively received almost $1.32 billion in revenue sharing in 2016. More than half a billion dollars ($560 million) was disbursed to 34 federally recognized American Indian tribes and more than 35,000 individual Indian mineral owners.
The remaining $2.8 billion went to two dedicated funds: $1.01 billion to the Reclamation Fund, which is used for water management and efficiency programs for the benefit of 17 western states, and $884 million to the Land and Water Conservation Fund, which provides grants to governments at all levels for easements, land acquisition, and overall conservation. The Historic Preservation Fund, which had received $150 million annually, expired at the end of FY2015.
Principal contributors: Natalie Kempkey, Matthew Manning