
U.S. crude oil storage capacity utilization rises even as storage capacity grows
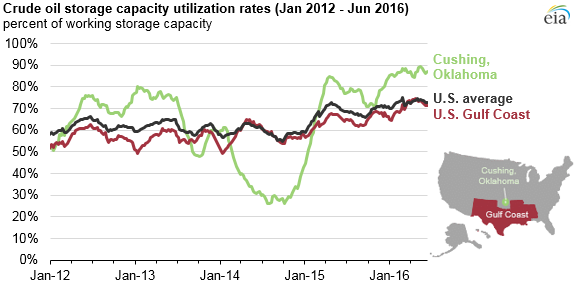
Weekly U.S. commercial crude oil inventories have increased by more than 71 million barrels (15%) since the end of September, pushing crude oil storage capacity utilization to a near record high of 73% for the week ending June 10.
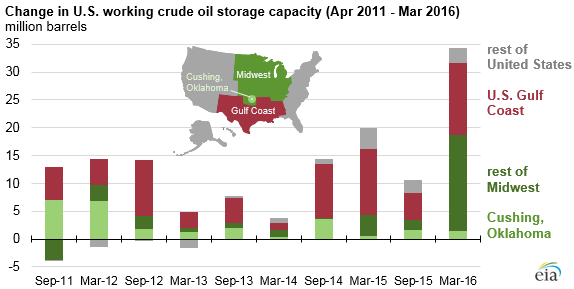
The U.S. Energy Information Administration measures crude oil storage capacity twice each year. From September 2015 to March 2016, the United States added 34 million barrels (6%) of working crude oil storage capacity, the largest expansion of commercial crude oil storage capacity since EIA began tracking such data in 2011.
The expansion of crude oil storage capacity helped to accommodate the growth in U.S. crude oil inventories, which surpassed 500 million barrels at the end of January 2016. U.S. crude oil inventories increased in 24 of the 30 weeks from September to March, reaching 532 million barrels for the week ending June 10. These commercial volumes exclude the 695 million barrels in the U.S. Strategic Petroleum Reserve.
Despite the large expansion in crude oil storage capacity, the net effect of capacity growth and increased inventories resulted in high storage utilization rates. Storage utilization at Cushing, Oklahoma, averaged 87% over the past four weeks, compared with 81% for the same period last year. U.S. Gulf Coast region storage utilization rates averaged 72% over the past four weeks, after never being more than 70% in the previous four years.
The large increase in crude oil storage capacity between September and March was prompted by increased demand for crude oil storage as global supply has outpaced global demand for most of the past two years. Because of generally rising crude oil inventories since the end of 2014, the structure of crude oil futures prices has been in steep contango, where near-term deliveries are priced lower than long-term deliveries. The large and continued contango structure prompted many market participants to place more crude oil into storage.
The largest commercial crude oil storage capacity expansions since September were in the Midwest and Gulf Coast regions, which added 19 million barrels and 13 million barrels, respectively. Combined, these regions account for 82% of total U.S. commercial crude oil storage capacity. Within the Midwest, storage capacity at Cushing, the delivery point for the Nymex WTI futures contract, expanded 1.5 million barrels.
Principal contributor: Mason Hamilton