
Crude oil volatility decreases as prices rise from early 2016 levels
Republished May 10, 2016, 1:00 p.m. to correct an error in the text.
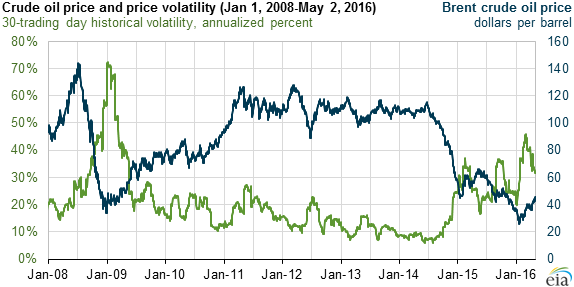
During the first three months of 2016, crude oil prices were relatively more volatile than in recent history. This elevated volatility occurred when overall oil prices were low, and volatility was driven by high uncertainty related to supply, demand, and inventories. Crude oil price volatility has declined since its peak in March. Prices have risen as concerns about future economic growth have abated and as inventory growth has slowed since the start of the year.
The 30-day measure of oil price volatility (calculated as the standard deviation of daily percent changes in crude oil prices over the previous 30 trading days) reached a high of 45% on March 4 before falling to 33% on April 18. Volatility levels in March were the highest since early 2009, when crude oil prices were falling in response to the financial crisis and to a drop in demand for petroleum products. The recent decline in oil prices resulted in volatility levels closer to the 2015 average of 27%.
Volatility often reflects market uncertainty about both the current and future value of a commodity. Daily volatility is often driven by the release of new economic or supply information, changes in market expectations, or unanticipated events that can cause large price adjustments.
Some reasons for volatility in crude oil prices include uncertainty about:
- Future production levels in key oil-producing nations
- Global economic growth, particularly in China and other emerging market economies
- Growth in U.S. gasoline demand following higher consumption levels in 2015
- Crude oil inventories and storage capacity constraints
Volatility also increased during unexpected interruptions in oil supply, such as the disruptions that occurred during the first Gulf War in 1990, in the aftermath of hurricanes in the U.S. Gulf of Mexico, and in Libya in the first half of 2011.
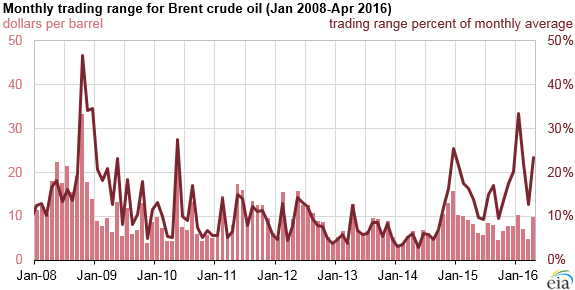
Monthly trading ranges, or the difference between the high and low closing oil prices in a given month, are another way of measuring volatility. In January 2016, Brent crude oil spot prices closed at a low of $26 per barrel (b) and a high of $36/b, and this $10/b trading range was higher than the range of any month in 2015. The magnitude of the trading range compared with the average monthly price was 33% in January, the highest since 2008.
Principal contributors: Robert McManmon, James Preciado
Tags: crude oil, financial markets, liquid fuels, prices