Declining energy prices lower the cost of living
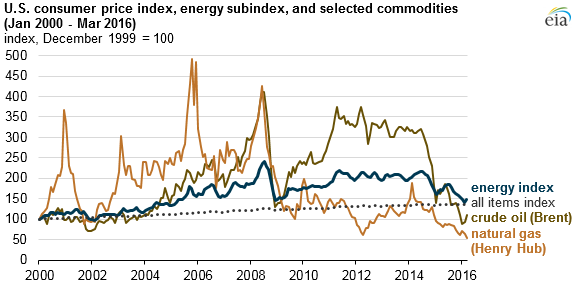
Since June 2014, decreases in crude oil and natural gas prices have reduced household energy costs. According to initial figures from the U.S. Bureau of Labor Statistics (BLS), the chained consumer price index for urban consumers (C-CPI-U) decreased by 1.2% from June 2014 to February 2016. Lower energy prices had a significant impact on this decrease in spite of increases in the food and shelter components of the overall index, which represent larger shares of household expenses. The overall index edged up 0.6% in March as real crude oil prices rose 18.1%, while natural gas prices continued to decline.
Between June 2014 and February 2016, the inflation-adjusted Brent crude oil and Henry Hub natural gas prices declined 71% and 56%, respectively. Prices for these two benchmarks are significant, as changes in the Brent crude oil price often lead to changes in gasoline, diesel, and heating oil costs, while changes in the Henry Hub price affect natural gas prices and, to a lesser extent, electricity prices. The energy component of the C-CPI-U decreased by 35.3%, reflecting the influence of declining spot prices on household energy prices.
The energy component of the consumer price index tends to be much more dynamic than other major components of the index: during the same period, the food and beverage component of the C-CPI-U increased by 2.5%, while the shelter component rose 5.1%. The energy component rose 4.9% from February to March 2016, remaining 12.9% below its 2015 average.
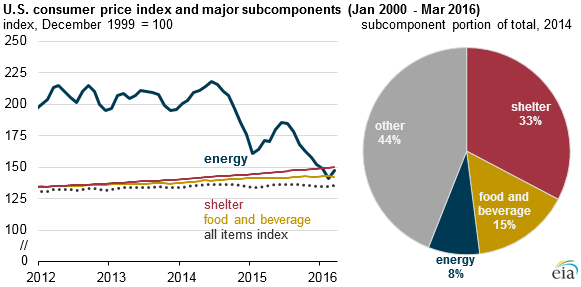
The all-items C-CPI-U measures changes in the overall cost of living for U.S. households based on data from several surveys, including the Consumer Expenditure Survey. The C-CPI-U formula accounts for substitutions that consumers sometimes make in response to changes in relative prices. For instance, if the price of gasoline rises, which increases the cost of commuting by car, some households may switch to public transit or ridesharing options. The energy index includes fuel oil, motor fuel, electricity, and natural gas, which together made up about 8% of household expenditures in 2014, the most recent year of available expenditure data.
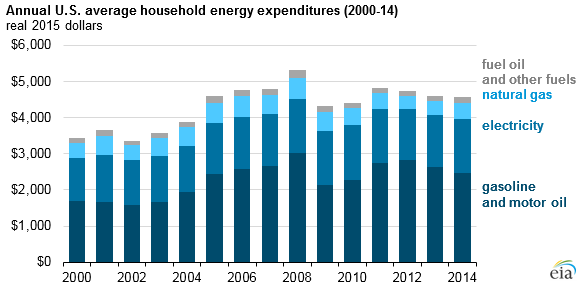
In constant 2015 dollars, average annual household energy expenditures peaked at about $5,300 in 2008. Between 2008 and 2014, average annual household energy expenditures declined by 14.1%. During this period, household expenditures decreased by 17.7% for gasoline, 25.1% for natural gas, and 28.3% for fuel oil. Electricity expenditures declined by a more modest 0.7%. EIA uses these average household energy expenditures to inform its outlooks for summer transportation expenditures and winter heating fuels expenditures.
Principal contributor: Janice Lent
Tags: crude oil, liquid fuels, natural gas, prices, residential