EIA report shows decline in cost of U.S. oil and gas wells since 2012
The profitability of oil and natural gas development activity depends on both the prices realized by producers and the cost and productivity of newly developed wells. Overall trends in well development costs are generally less transparent than price and productivity trends, which are readily observable in the markets or through analyses of well productivity trends such as EIA's monthly Drilling Productivity Report.
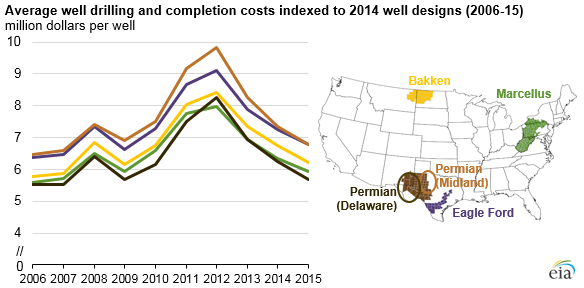
In an effort to increase understanding of the costs of upstream drilling and production activity, EIA commissioned IHS Global Inc. (IHS) to study these costs on a per-well basis in the Eagle Ford, Bakken, Marcellus, and Permian regions, analyzing the Permian's Midland and Delaware basins separately. Upstream costs in 2015 were 25% to 30% below their 2012 levels, when per-well costs were at their highest point over the past decade. Changes in technology have affected drilling efficiency and completion, supporting higher productivity per well and lowering costs, while shifts towards deeper and longer lateral wells with more complex completions have tended to increase costs.
Costs per well generally increased from 2006 to 2012, demonstrating the effect of rapid growth in drilling activity. Since 2012, costs per well have decreased because of reduced overall drilling activity and improved drilling efficiency and tools. Changes in costs and well parameters, such as the need to drill deeper or longer lateral wells, have affected the onshore oil plays differently in 2015, with recent per-well costs ranging from 7% to 22% below 2014 levels.
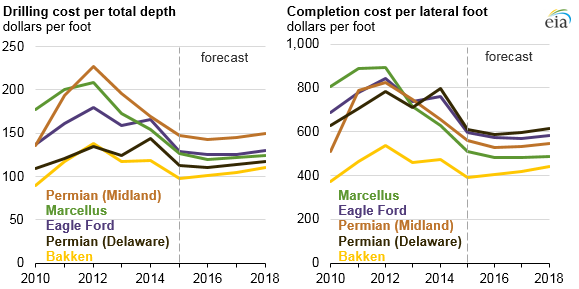
Differences in geology, well depth, and water disposal options can affect costs for each onshore oil play area. The adoption of best practices and the improvement of well designs have reduced drilling and completion times, decrease total well costs, and increase well performance. Greater standardization of these drilling and completion practices and designs across the industry should continue to lower costs. The drilling cost per foot, based on total depth, and the completion cost per foot, based on lateral length, are both projected to maintain these lower cost trends through 2018. Sustained lower upstream costs may affect near-term oil and natural gas markets, and ultimately, the prices of these fuels.
Principal contributors: EIA Staff
Tags: drilling, liquid fuels, natural gas, oil/petroleum